
包阅导读总结
1. `Insights、Debugging Workflows、Web Vitals、Mobile Screen Loads、Database Queries`
2. 本文主要介绍了名为 Insights 的调试工作流,适用于商业和企业计划,可帮助检查应用关键组件等,还能追踪 Web Vitals、调试手机屏幕加载慢、连接数据库查询与代码的问题,提升性能监控和故障排除能力。
3.
– Insights 调试工作流
– 帮助轻松检查应用、基础设施和依赖的 API
– 定位导致 429 状态码激增的具体函数或代码行
– 追踪 Web Vitals 问题至根源
– 监测核心 Web Vitals,如 LCP 问题
– 展示可优化页面,通过追踪定位延迟元素和资源,借助 Profiling 诊断根本原因
– 调试手机屏幕加载慢
– 提供移动应用屏幕加载时间概述
– 跟踪 TTID 和 TTFD 关键指标
– 能筛选耗时操作,定位导致缓慢的具体代码
– 连接缓慢数据库查询与代码
– 查看数据库性能,了解耗时查询及其影响
– 展示具体查询并可直接导航至代码中的相关行
思维导图: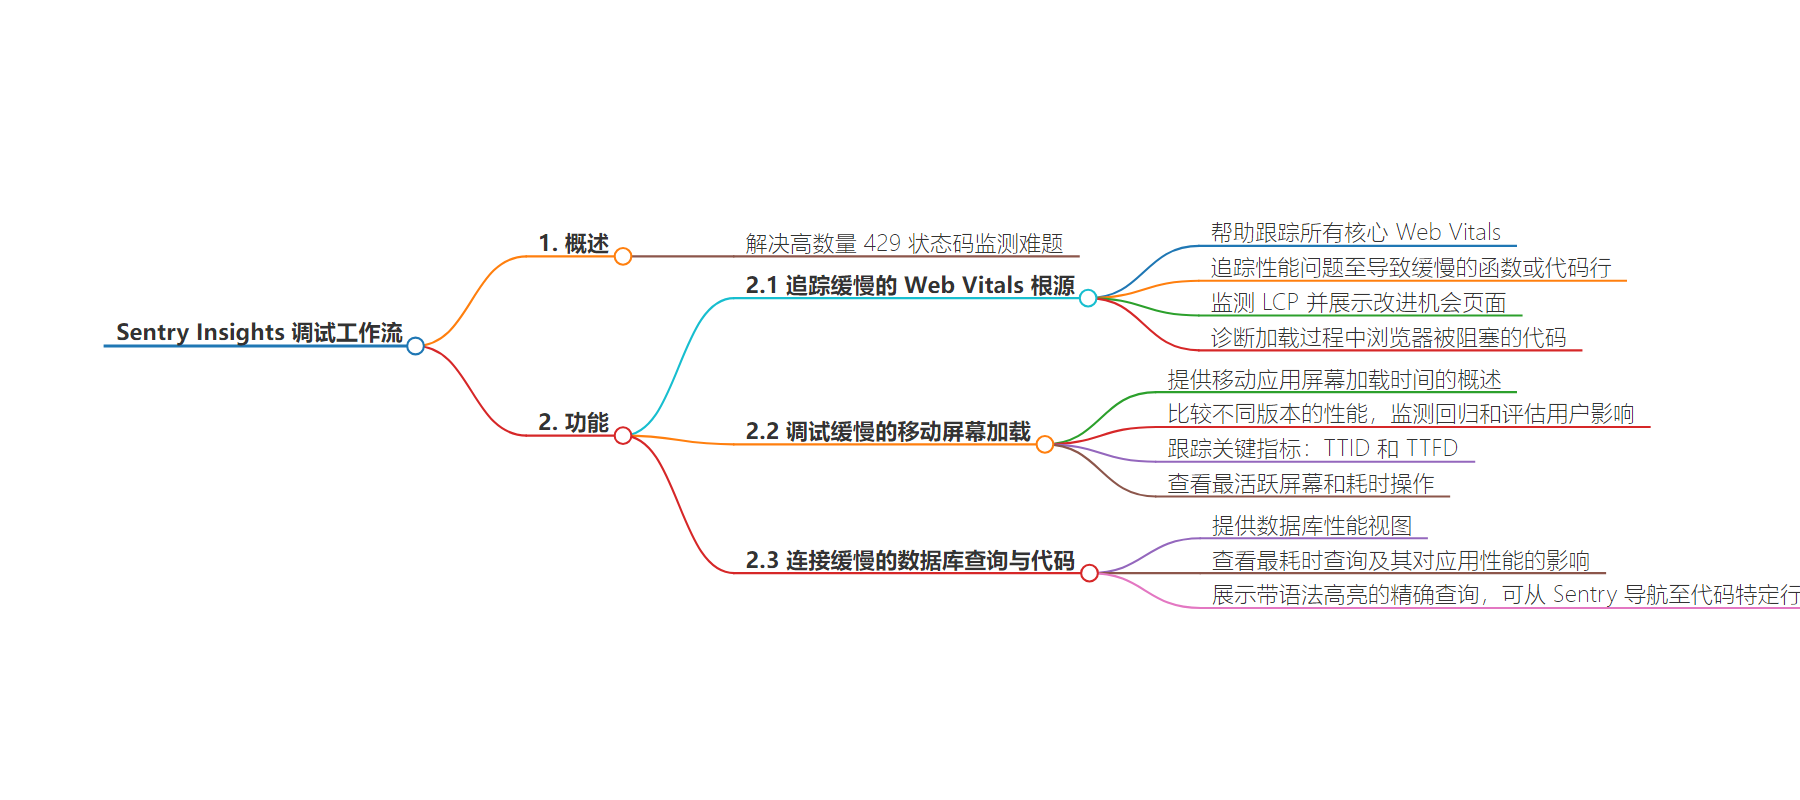
文章地址:https://blog.sentry.io/introducing-insights-tailored-debugging-workflows-for-your-applications/
文章来源:blog.sentry.io
作者:Sentry Blog
发布时间:2024/7/8 0:00
语言:英文
总字数:791字
预计阅读时间:4分钟
评分:83分
标签:性能监控,调试工作流,Sentry 洞察,Web Vitals,移动应用性能
以下为原文内容
本内容来源于用户推荐转载,旨在分享知识与观点,如有侵权请联系删除 联系邮箱 media@ilingban.com
Introducing Insights: Tailored debugging workflows for your application

You’re seeing an unusually high number of 429 status codes, but your monitoring solution can’t tell you much beyond that. Typically, that’s when you start searching through logs — while simultaneously sustaining the urge to walk away and hope someone else deals with it.
To make sure neither of those happens, we made a new set of debugging workflows aptly named Insights. Available on our Business and Enterprise plans, Insights helps you easily gut-check key components of your application, the infrastructure, and the APIs it relies on, and drill down to the specific function or line of code causing that spike of 429s. And just like every great infomercial – but wait, there’s more!
Trace slow Web Vitals to their root cause
Sentry Insights helps you track all Core Web Vitals, and trace performance issues directly to the function or line of code causing the slowdown.
Imagine your store just dropped the latest sneaker. Sneakerheads from everywhere land on your page, but the main image takes a while to load, leaving many to bounce to another store that they already have loaded in another tab. This is a common LCP (Largest Contentful Paint) issue, where the largest piece of content—an image or text block—takes too long to appear on the screen, leading users to think the page is broken.
Sentry’s Web Vitals Insights helps you monitor LCP so you can see how long it takes for the largest content element to render. Sentry also shows you the pages with the most significant opportunity for improvement and lets you dive into them for further troubleshooting.
With tracing, you can then start from the poor LCP score and use the spans in the trace to quickly identify the associated element and resource that’s causing delays. Then, with Sentry’s Profiling, you can diagnose the root cause by identifying which code the browser was blocked on during the loading process.
Debug slow mobile screen loads
Whether it’s a missed package due to a slow-loading doorbell stream or being late to an important meeting because your conferencing app takes too long to start. Every second counts (yes, we watch The Bear too).
Screen Loads Insights provides an overview of your mobile app’s screen loading times, allowing you to compare performance across releases, monitor regressions, and assess user impact. It will even guide you to the specific code causing issues, so you can quickly halt rollouts or push fixes when necessary.
As a refresher, Screen Loads tracks two key metrics:
- TTID (Time to Initial Display): How long it takes for a user to see the first frame, indicating that the app is loading.
- TTFD (Time to Full Display): The time it takes for the app to become fully interactive with all content loaded.
With Screen Loads, you can view the most active screens in your app and filter by the most time-consuming operations, causing your TTID or TTFD to be slow. From there, you can jump into a specific operation, see connected issues, and additional debugging context like version, device, and network variables. So the next time your users complain it’s taking forever to log into your app, you can trace from the time-consuming span to the code changes, dependencies, or assets causing the slowdown.
Connect slow database queries to code
While monitoring Web Vitals and mobile UI behavior is important, it’s only half the story. Since most frontend performance issues are caused by the backend, we’ve added several backend Insights, including Queries.
Queries Insights provides a view into your database performance, allowing you to see your most time-consuming queries and how they impact your application’s performance.
So the next time a customer can’t add new shoes to their cart or their login times out, you can quickly see where there are spikes in duration and dive deeper to see the performance impact — including where in the code it’s triggering the issue.
Additionally, we’ll show you the exact query with syntax highlighting, and if your GitHub repository is linked to the project, you can navigate directly from Sentry to the specific line in your code.