
包阅导读总结
1. 关键词:网站性能、技术更新、优化策略、用户体验、加载速度
2. 总结:本文讲述了网站性能优化的重要性,介绍了某公司为提升网站性能所做的努力,包括改变网站定位、采用新技术和策略,并详细说明了所取得的成果。
3. 主要内容:
– 网站性能的重要性
– 加载慢会导致诸多问题,如客户流失、收益受损、SEO 排名下降和用户体验差。
– 决定优化网站性能的原因
– 面临低转化率和网站管理责任方面的问题。
– 第三方机构的网站重设计不成功。
– 优化网站的文化转变
– 将网站视为关键产品,而非手段。
– 团队采取了一系列关键的思维转变。
– 提升网站性能的措施
– 评估性能等多方面,确定可使用的技术。
– 采用七种工具和技术,如懒加载、DOM 尺寸缩减、Redis 缓存等进行优化。
– 展示各项优化措施的效果和数据。
思维导图: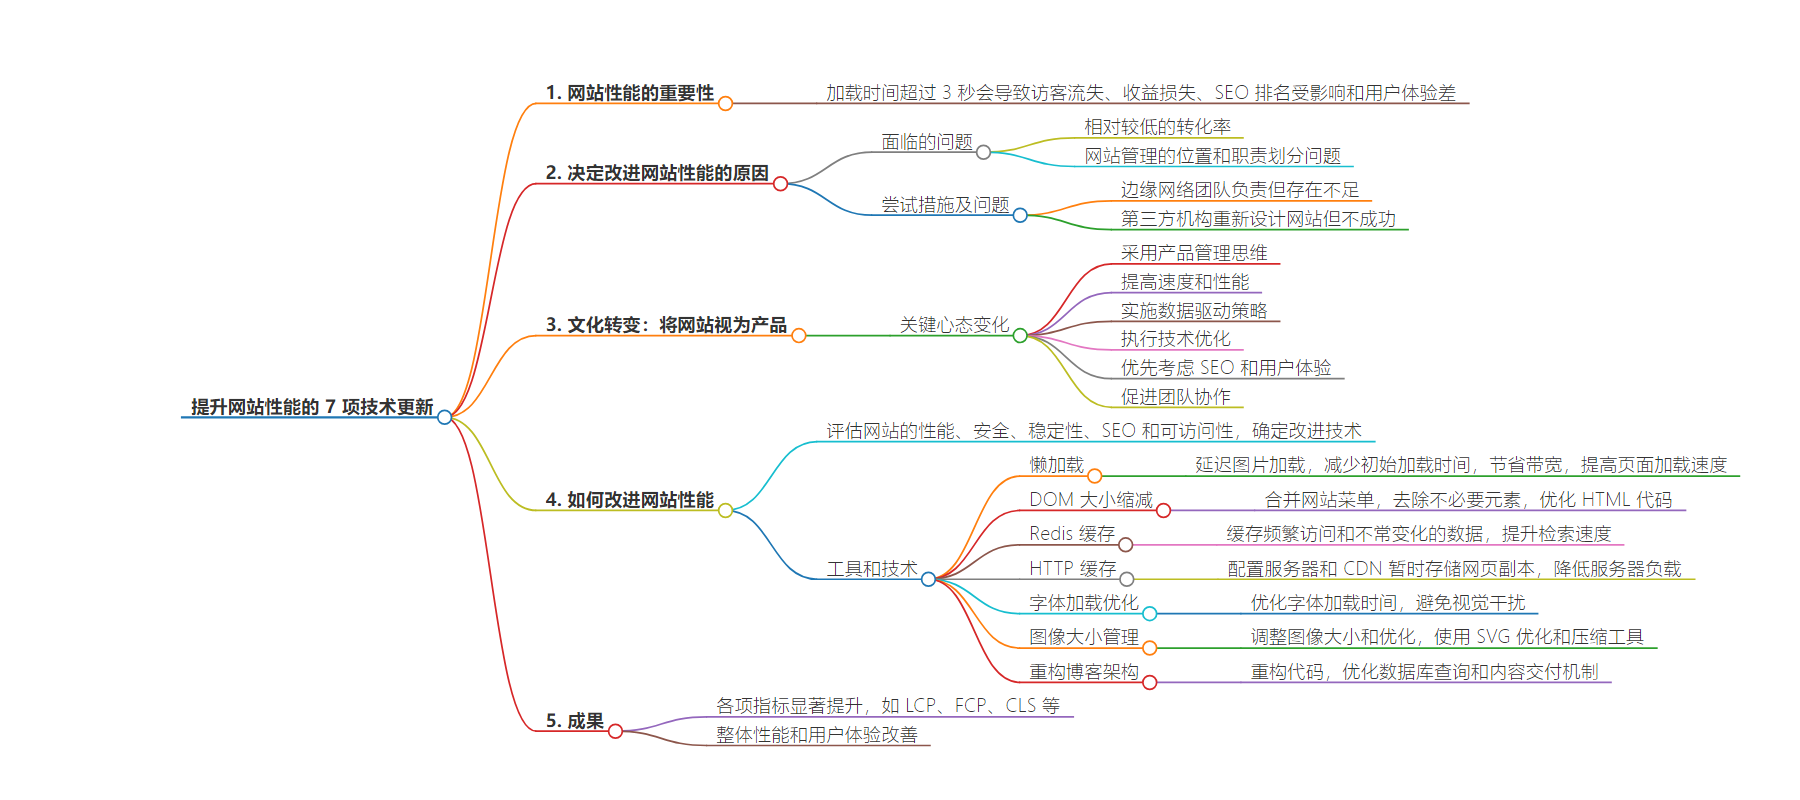
文章地址:https://thenewstack.io/7-technical-updates-to-boost-website-performance/
文章来源:thenewstack.io
作者:Elena Bolshakova
发布时间:2024/6/24 14:09
语言:英文
总字数:1613字
预计阅读时间:7分钟
评分:81分
标签:网站性能,网站优化,网页开发,延迟加载,DOM 大小缩减
以下为原文内容
本内容来源于用户推荐转载,旨在分享知识与观点,如有侵权请联系删除 联系邮箱 media@ilingban.com
Most website visitors will abandon a website if it takes more than three seconds to load. Slow loading times mean lost customers, lost revenue, negatively impacted SEO rankings and a poor user experience. No matter how great your product is, a slow website benefits your competition and harms your business.
We recently underwent a major website performance improvement process to ensure our customers have a positive experience from the first click. In this and a follow-up article, I’ll explain why and how we improved Gcore’s site speed and the results we achieved. The methods I’ll share here are broadly applicable and can help your business achieve similar results.
Why We Decided to Improve Our Web Performance
Like many businesses, we faced significant website performance challenges in 2022. Our biggest problems were:
- Relatively low conversion rates.
- Location and division of website management responsibilities.
To remedy these challenges, our Edge Network team took on the additional responsibility of managing the website. Despite this being outside their primary focus area, they did an excellent job. However, as their attention was primarily on our rapidly growing Edge Network product group, some inefficiencies and missed opportunities naturally arose.
We then hired a third-party agency to undertake a website redesign, which wasn’t entirely successful. We faced a number of challenges that are common to agency outsourcing, like missed deadlines, slow development, uncoupling of design and development, and slow bug fixes. As complaints from product marketing managers, senior management and — most importantly — our customers started to come in, we realized it was time for a new approach.
Culture Shift: Website as Product
The end results we were chasing — great user experience, website speed, SEO, analytics and overall functionality — required a total culture shift in how we approach the website. We decided to treat it as a key product instead of a means to an end.
We anticipated that adopting a structured website product management approach would facilitate long-term planning and establish clear management and ownership, all essential to the practical results we were seeking.
Here are the key mindset changes we adopted within the team in order to treat our website as a product:
- Adopting a product management mindset: Driven by a concerted effort to adopt a product management approach, we emphasized data-driven decision-making and cross-departmental collaboration for the website.
- Improving speed and performance: By treating the website as a product, we made significant improvements in speed and performance, guided by clear metrics, strategies, goals and targets.
- Implementing data-driven strategies: We adopted a data-driven approach focusing on key technical and speed metrics to inform our optimization efforts. We thoroughly investigate performance drops to identify and address root causes.
- Executing technical optimizations: Our developers implemented key changes, including code optimization, asset minification, server enhancements and caching strategies to improve website speed. Every team member contributed ideas that were brought to life.
- Prioritizing SEO and UX: Improving website speed is crucial for SEO, user experience (UX) and organic traffic growth. Faster websites rank better on search engines and provide a better user experience.
- Fostering team collaboration: Our team-based approach has all departments working towards common goals, promoting collaboration and shared responsibility for the website’s success.
How We Improved Site Performance
The next step was to assess the website’s performance, security, stability, SEO and accessibility and determine the technologies we could use to improve each factor.
Site performance was the obvious starting point because it was easy to see where we were lacking and make effective changes. We used seven tools and technologies to measure our site speed and identify areas for improvement.
1. Lazy Loading
This technique delays the loading of images until they are needed, typically when they come into the user’s viewport as they scroll down the page. By loading images only as they become visible to the user, we reduce the initial load time of the web page, conserve bandwidth and improve page loading times.
When we first implemented lazy loading in November and December 2023, we were able to achieve faster largest contentful point (LCP) and first contentful point (FCP) metrics. Between April and May 2024, LCP improved by 24%, while FCP improved by 31%. These enhancements led to a nearly 6% higher overall performance score in the same month.
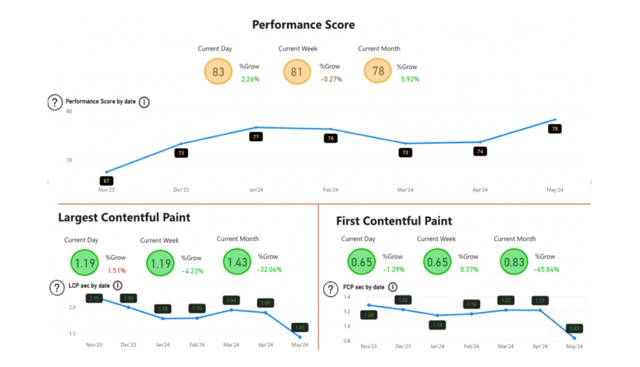
Performance score trends from Nov 2023 to May 2024 show significant improvements in LCP and FCP between April and May 2024.
2. DOM Size Reduction
Minimizing the number of HTML elements in a webpage’s document object model (DOM) led to faster rendering times and reduced memory usage. We achieved this by combining the mobile and desktop versions of our website’s menu into a cohesive structure, eliminating redundancy and reducing the number of DOM elements. We also conducted a thorough audit to remove unnecessary elements, such as outdated code and hidden components, further streamlining the HTML structure. By optimizing the HTML code and reducing its complexity, we made the DOM smaller and more efficient.
In October 2023, our website had about 2,500 DOM elements, which we reduced to 1,300 by December 2023 and to 1,000 by May 2024. Currently, the DOM size is 1,040, a 58% decrease over the past seven months.
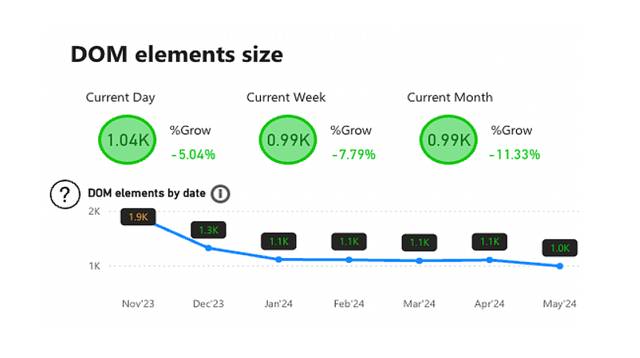
DOM element size trends from Nov 2023 to May 2024 show a reduction from 1.9K to 1.0K elements and improved growth rates.
3. Redis Cache
We implemented caching using Redis, an in-memory data structure store. By caching frequently accessed, infrequently changing data such as blog content, Redis allows faster retrieval times compared to traditional disk-based systems. Monitoring tools like Grafana and Site24x7 help us track response times and verify the strategy’s effectiveness.
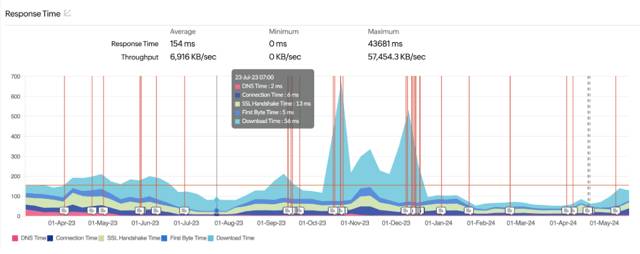
Site24x7 monitoring dashboard for Gcore.com/blog, showing response time, throughput and status from January 2023 to May 2024.
The consistently low average response time of 154ms and efficient throughput of 6,916KB/sec returned by Site24x7 data confirm that our Redis caching strategy has significantly improved performance, reduced server load and enhanced scalability, enabling our website to handle higher traffic volumes efficiently.
4. HTTP Cache
Enabling HTTP caching reduces the load on the origin server, improves response times and protects against DDoS attacks. To achieve this, we configured the server and content delivery network (CDN) to temporarily store copies of web pages, images and other assets. The HTTP cache has significantly improved response times, with an average response time of 187ms and a throughput of 6.306KB/sec.
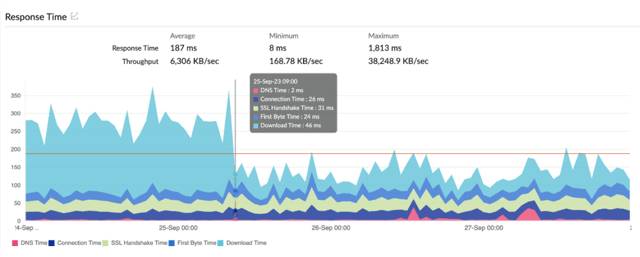
Site24x7 dashboard for Gcore.com displaying response time, throughput and status metrics for the week ending September 25, 2023.
We rely on HTTP caching on the CDN side, which helps distribute the load and protect the origin server. We verified the correctness of cache-control headers on the backend and checked that the CDN respects these headers. Although caching for long periods is not advisable, setting cache durations of 1–5 minutes strikes a good balance for us. For static content, which makes up most of our website, longer caching times are feasible and beneficial. This approach is demonstrated in our response time metrics, which show significant improvement due to the effective use of HTTP caching.
5. Font Loading Optimization
Loading fonts efficiently avoids visual disruptions, like blinking effects, that can detract from the user experience. By optimizing font loading times and avoiding the 2.5-second threshold for Core Web Vitals (CWV) and SEO, we significantly improved performance. Techniques such as preloading assets instruct the browser to load fonts early. The font-display: swap rule makes the browser display text with a fallback font immediately, switching to the web font once it’s loaded. These approaches minimize layout shifts and create a smooth visual experience for users.
Cumulative Layout Shift (CLS) measures a web page’s visual stability by tracking unexpected layout shifts. A lower CLS score indicates a stable and user-friendly site. Frequent layout shifts can frustrate users, leading to poor website perception and increased bounce rates.
Our CLS score decreased from 0.062 in November 2023 to 0.038 in February 2024, which indicates that we enhanced stability and reduced visual disruptions on Gcore.com.
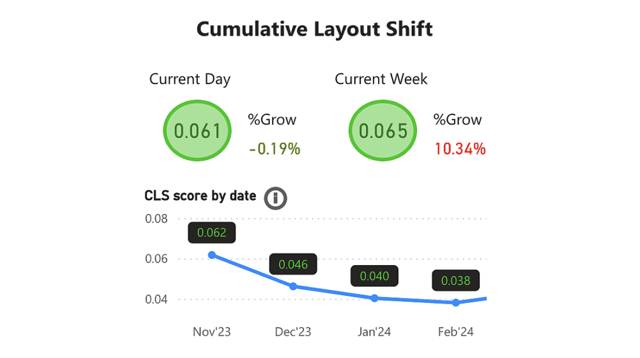
Graph showing the decrease in Gcore’s Cumulative Layout Shift (CLS) score from 0.062 in November 2023 to 0.038 in February 2024.
6. Image Size Management
Our image sizes weren’t consistent at the start of the project, meaning some pages loaded slowly due to one or more outsized images. Using the NgOptimizedImage directive, we resized and optimized images to address PageSpeed issues caused by large image files. We also use SVG optimization (SVGO) to clean and optimize SVG images before pushing them to Bitbucket, reducing file sizes between 5% and 60%.
We then integrated an image stack and Gzip compression into our workflow. These tools compress images by 30% to 70%, significantly improving the LCP and FCP metrics. The result is a faster user experience.
7. Restructured Blog Architecture
We thoroughly restructured our website’s blog architecture to address performance bottlenecks and improve overall site speed. This meant refactoring the codebase, optimizing database queries and improving the content delivery mechanisms across the whole site. By streamlining the architecture, we reduced server response times and improved throughput, as evidenced by the graph in item 4 above, which shows an average response time of 154ms and a throughput of 6,720KB/sec. These numbers show significant improvement in server performance. A lower response time means faster server reactions and enhanced processing speed, which gives efficient data handling capacity.
Next Steps
Beyond performance, we also decided to strengthen our website against security vulnerabilities, take steps to maintain consistent uptime, boost search engine optimization (SEO) and improve accessibility. I will discuss how we implemented those improvements in part 2 of this series.
YOUTUBE.COM/THENEWSTACK
Tech moves fast, don’t miss an episode. Subscribe to our YouTubechannel to stream all our podcasts, interviews, demos, and more.