
包阅导读总结
1. 关键词:Debuggability、Monitoring、Observability、Developer Workflow、Sentry
2. 总结:本文介绍了监测、可观测性和可调试性的概念,强调了可调试性在开发工作流中的重要性,指出其能帮助开发者快速解决问题,以 Sentry 为例说明可调试性平台的作用。
3. 主要内容:
– 监测工具:能告知应用出错及整体影响,帮助开发者快速识别应用问题。
– 可观测性:为 DevOps 提供应用内部状态洞察,包括日志、指标和跟踪,但开发者仍需可操作数据。
– 可调试性:是解决问题的关键,能让开发者快速定位并解决错误和性能问题,Sentry 是首个可调试性平台。
– 受益方:开发团队全员受益,可调试性使组织积极诊断和解决问题,提升效率。
– Sentry:提供跨数据的连接调试体验,强调数据的情境化和可操作性。
思维导图: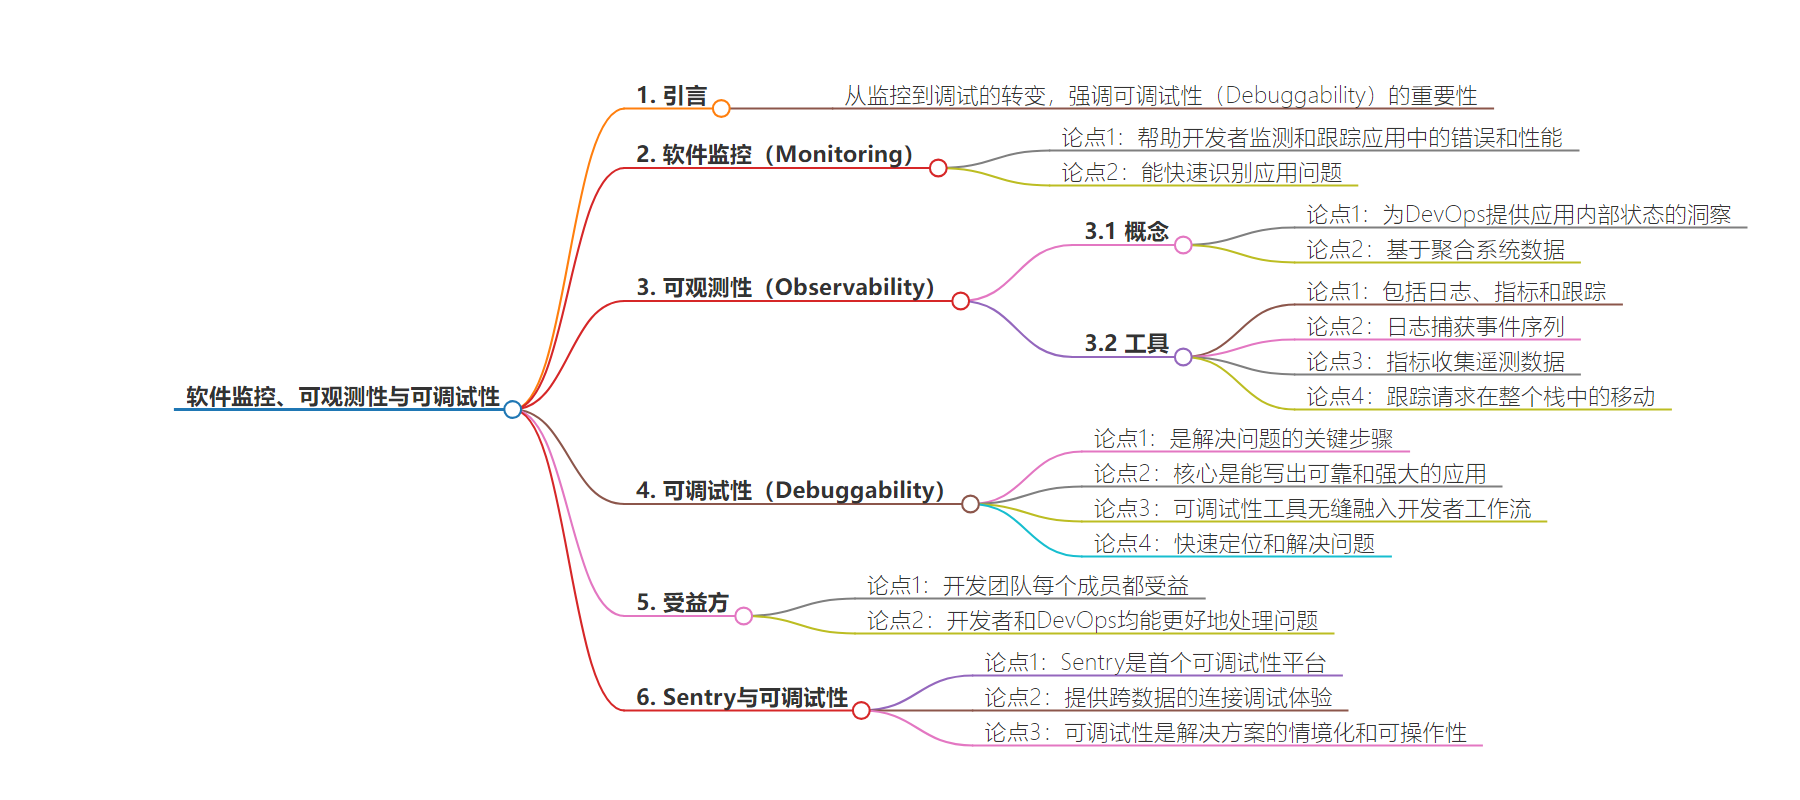
文章地址:https://blog.sentry.io/monitoring-observability-and-debuggability-explained/
文章来源:blog.sentry.io
作者:Sentry Blog
发布时间:2024/7/31 0:00
语言:英文
总字数:978字
预计阅读时间:4分钟
评分:85分
标签:监控,可观测性,可调试性,开发者工具,Sentry
以下为原文内容
本内容来源于用户推荐转载,旨在分享知识与观点,如有侵权请联系删除 联系邮箱 media@ilingban.com
Monitoring tools are great at letting you know when something is broken and the overall impact. We should know, we make an error monitoring tool. Observability tools are good for well, observing. But here’s the thing, you (we) don’t observe code. We (you) push code. So what the collective “we” need is a tool that makes it easy to ship, improve, and maintain reliable and performant code. That’s why we’re shifting the conversation from just monitoring to debugging, and there’s no room for just observing.
Nobody would disagree that debugging is critical in your developer workflow, but what if you take that often ad-hoc, reactive “oh $h@t” moment and turn that into an entire practice? We’re talking about Debuggability. Not O11Y, but D11y. And while you may already be convinced that debuggability is critical in your developer workflow, let’s set the stage for what that truly means in comparison to monitoring and observability alone.
What is software monitoring?
Monitoring allows developers to monitor and track errors and performance in their applications, whether on web, mobile, desktop, or game console. Monitoring tools typically help developers with both errors and performance:
Basically, monitoring helps developers quickly identify application issues.
What is observability?
Observability traditionally caters to the DevOps function with insights into an application’s internal state based on aggregated system data. Often referred to as the “three pillars of observability,” observability tools include the use of logs, metrics, and traces to gain a comprehensive understanding of how an application is operating.
- Logs capture detailed sequences of events within an application.
- Metrics involve a more granular and extensive collection of telemetry data.
- Traces follow requests as they move through the entire stack.
For DevOps, observability enables exploratory analysis, making understanding complex interactions within large distributed systems easier. However, developers themselves still need actionable data that enables them to fix issues quickly and efficiently.
So, what is debuggability exactly?
When it comes to building reliable and robust apps, think of monitoring and observability as the first steps in the process. While monitoring and observability help you identify issues, ultimately, you need to solve those issues. And that’s where debuggability comes in.
At its core, debuggability is the practice that enables us to write and ship code that delivers exceptional user experiences. And a debuggability tool is one that fits seamlessly into your developer workflow; giving you the context you need, when and where you need it, to trace the issue to the line of code (and person best fit to solve the issue) so that errors and performance issues alike are fixed fast. In a nutshell, debuggability refers to how easily and quickly a developer can debug through the entire system.
Debuggability tools like Sentry enhance developer workflows with connected, contextualized, and intuitive information so they can find and fix the root of a problem, no matter where it occurs across a distributed system. With a debuggability tool, less time is wasted in trying to figure out what the issue is, where it is, and who is best to fix it. Developers get to the root cause quickly, whether they start from a high-level view of their system or from a targeted search of a specific user, route, or API endpoint. Everyone on your team gets the context they need to solve problems quickly, without switching tools, needing to recreate the problem on their local machine, or wasting time guessing. And this is all done without needing to make sense out of multiple dashboards and sift through volumes of raw data across logs and other telemetry to figure out why your app is broken.
Who benefits from a renewed focus on debuggability?
Every member of a development team benefits from a focus on debuggability. While developers rely on monitoring tools for things like alerts, DevOps is able to navigate vast amounts of information from an observability tool, thereby providing the necessary context to positively impact the reliability, robustness, and quality of an application. Debuggability brings these paradigms together. Without debuggability, developers will often find themselves spending valuable time trying to identify what and where the issues are, who should be best to fix them, how they’re affecting your users, and the impact on the entire application that those issues create.
Debuggability involves being proactive, enabling an organization to easily diagnose and resolve issues. Effective debuggability requires having the right tools, practices, and insights to quickly identify and address the root cause of problems. Enhanced debuggability makes it straightforward to pinpoint a slow web page caused by a backend issue, and comprehensive system context allows for seamless resolution of user experience problems without needing reproduction steps.
Obviously, monitoring and observability exist to help developers and DevOps ship and maintain good, reliable software. Monitoring provides the initial alert that something is wrong and observability offers deeper insights into what and why something is happening. Debuggability, however, encompasses the entire experience, ensuring that once an issue is identified, developers have the relevant context and information to resolve it efficiently and effectively.
Sentry is Debuggability
Sentry is the first debuggability platform, offering a connected debugging experience across traces, metrics, and other key pieces of data. The tools that makeup Application Performance Monitoring, like error monitoring, performance monitoring, session replay, code coverage, and crons monitoring, contribute to a system’s overall observability. Having a system with good monitoring and observability is the start, as ultimately, developers need data that is actionable. And that’s where debuggability comes in. Debuggability is the contextualization and actionability of a solution. Simply put, debuggability exists to help developers know how to fix issues, and making data actionable is what Sentry is all about.