
包阅导读总结
1. 关键词:Data、Actionable Insights、Analysis、Business Decisions、Monitoring
2. 总结:文章讲述将数据转化为可操作见解的最后一步是分析和检索,以电商卖番茄罐头为例,说明了要全面分析数据,找出关键发现、情境化见解、确定优先级并持续监测,遵循关键步骤可助组织达成目标。
3. 主要内容:
– 数据转化为可操作见解的最后一步是分析和检索
– 要明确数据所呈现的模式和趋势对业务的意义及如何用于决策
– 以电商卖番茄罐头为例
– 品牌 A 页面流量上升但转化率低于品牌 B,A 月销售额上升
– 品牌 B 价格低,转化率高且稳定
– 如何将数据转化为可操作见解
– 识别关键发现,如品牌 A 销售上升且未影响 B 销售
– 情境化见解,探讨异常发生原因
– 确定发现的优先级
– 持续监测,数据见解会随新数据变化
– 遵循关键步骤将数据转化为可操作见解可助组织达成目标
思维导图: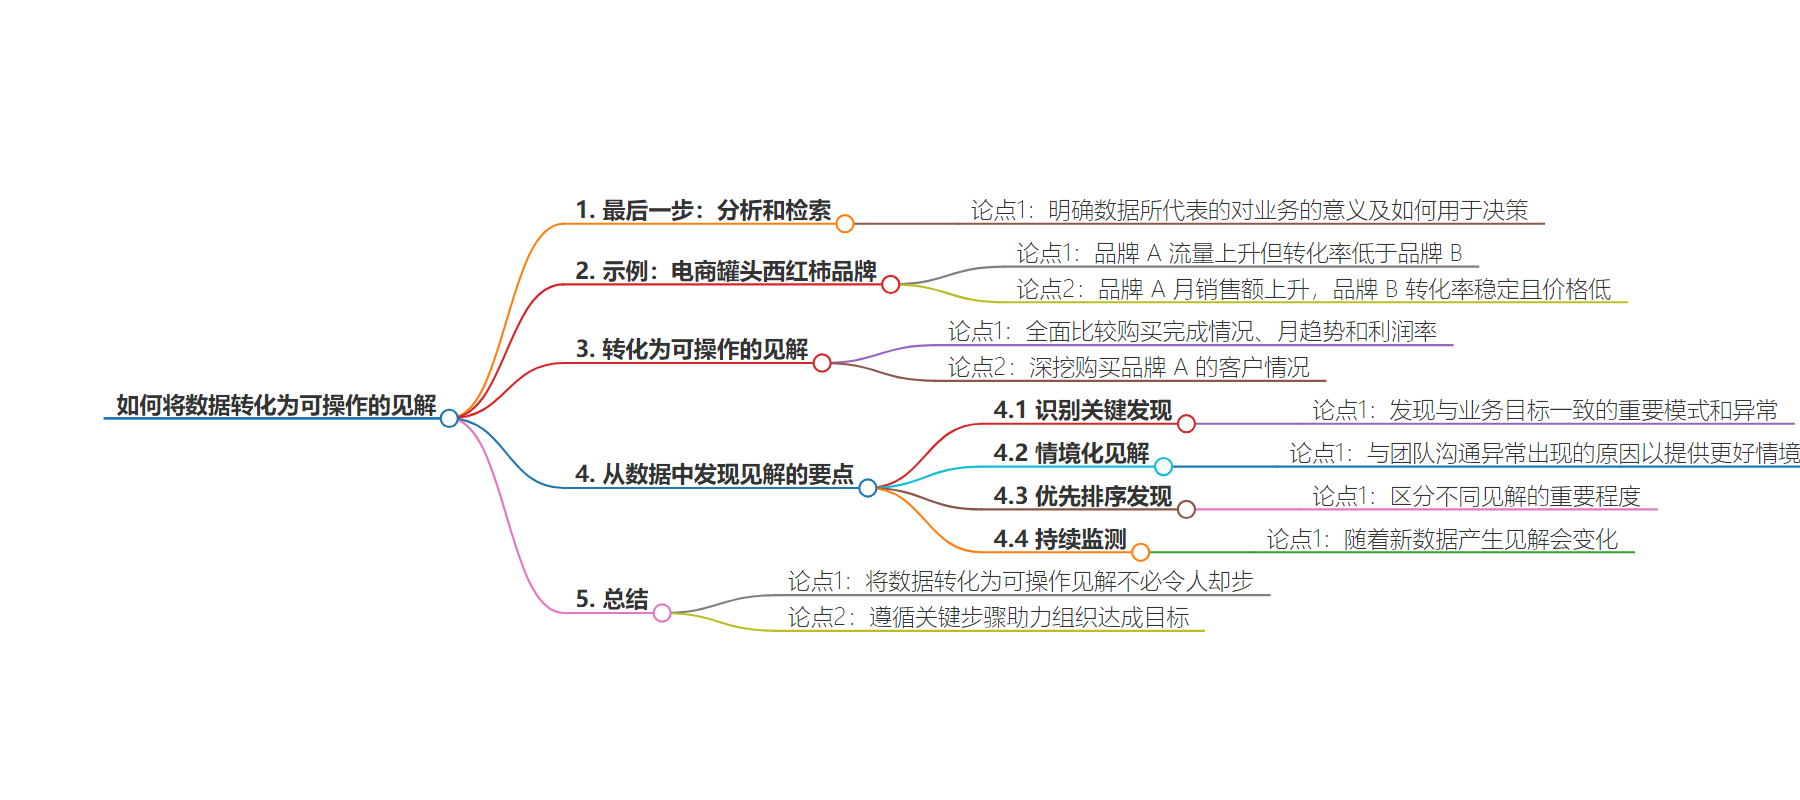
文章地址:https://www.elastic.co/blog/how-to-turn-data-into-actionable-insights
文章来源:elastic.co
作者:The Elastic Platform team
发布时间:2024/9/10 14:02
语言:英文
总字数:1643字
预计阅读时间:7分钟
评分:84分
标签:数据分析,商业洞察,数据驱动决策,数据可视化,数据管理
以下为原文内容
本内容来源于用户推荐转载,旨在分享知识与观点,如有侵权请联系删除 联系邮箱 media@ilingban.com
The last step in turning data into actionable insights is analysis and retrieval. This means figuring out what the patterns and trends you’ve spotted mean for your business and how you can use them to make more informed decisions.
For example, say your ecommerce store sells two different brands of canned tomatoes. The marketing team contacts you and asks how tomato brand A is doing because it recently got some online attention when it was featured in a spaghetti recipe by a famous chef. After examining the data, you discover that traffic to brand A’s page has spiked: it has twice the amount of traffic but a lower conversion rate than tomato brand B, which has less traffic but a higher conversion rate. However, your month-over-month data shows that overall sales for brand A are up even though the conversion rate is down. Brand B, which has a lower price, has historically had a higher conversion rate which remains steady month over month.
What would this data look like if it was turned into actionable insights?
Simply presenting the conversion rates isn’t the full picture. You want to compare the completed purchases, month-over-month trends, and profit margins of the two brands. You might want to dig deeper and see if people purchasing brand A are new customers or if there are any other items they’re also adding to their carts. (Yes, many are new customers. And, oh look, they’re also buying the same brand of spaghetti the famous chef recommended.)
Finding insights in the data means you have:
-
Identified key findings: You spotted significant patterns and/or anomalies in your data that align with your business objectives. For example, Brand A sales are up without affecting the sales of Brand B, and spaghetti sales are up, too. That’s good!
-
Contextualized the insights: You and the marketing team communicated about why this anomaly might be happening in the first place, which allowed for better context.
-
Prioritized the findings: Not all insights are equally important. For example, brand B’s consistent sales are good to note but don’t need to be focused on.
-
Continued monitoring: These insights aren’t static — they will evolve as new data is continuously generated, which you can derive insights from later.
This way, your data has given marketing the information they need to take action. They’ll spend the next month promoting brand A and the spaghetti to try to boost sales. Meanwhile, you’ll continue to monitor the data and see if their promotional campaign was helpful while also looking for any new patterns or anomalies along the way.
Turning data into actionable insights doesn’t have to be intimidating. By following a few key steps — gathering and cleaning your data, analyzing and visualizing it, and then highlighting insights — you can enable your colleagues and stakeholders to make informed decisions that help your organization reach its goals.