
包阅导读总结
1. 关键词:Canva、实验分析、数据科学、平台演进、改进措施
2. 总结:本文介绍了 Canva 公司实验分析的发展历程,包括初始框架的创建、遇到的问题,以及移交工程团队后的改进和当前架构的优化,强调了继续提升实验分析平台的目标。
3. 主要内容:
– 实验分析在 Canva 产品开发中的重要性
– 初始阶段
– 开发第一版实验分析框架,以 Python 包计算和解读结果,自动计算护栏指标
– 创建 Django 网页应用来共享分析结果
– 发展中的问题
– 数据科学家工作繁琐,新成员上手难
– 工程师和产品经理无法自助探索
– 系统规模增长导致结果更新不及时
– 平台信任度降低
– 演进
– 移交工程团队,实现按需创建和运行分析配置
– 整合进 Feature Control,统一用户流程
– 技术改进,如包装统计模型为 Python 库
– 发布教育项目,减少帮助请求
– 当前架构
– 重新设计用户创建实验分析组件的方式,提供点击界面
– 技术上在单独微服务中存储和管理组件
– 未来展望
– 继续让实验分析普及,优化工作流程和实验结果的学习性
思维导图:
文章地址:https://www.canva.dev/blog/engineering/how-we-build-experiments-in-house/
文章来源:canva.dev
作者:Vincey Au
发布时间:2024/6/27 10:02
语言:英文
总字数:1230字
预计阅读时间:5分钟
评分:86分
标签:工程实践,实验,数据驱动
以下为原文内容
本内容来源于用户推荐转载,旨在分享知识与观点,如有侵权请联系删除 联系邮箱 media@ilingban.com
Experimentation is an invaluable decision-making tool, and at Canva, it’s a pivotal step in our product development process to quickly test ideas, measure impact, and safeguard the customer experience of over 100 million monthly active users. We split our experimentation platforms into 2 core components:
- Experiment setup: Creating feature flags and assignments.
- Experiment analysis: Measuring the impact of the change.
In this blog post, we will dive into how the second component, experiment analysis, has evolved over the last few years to support a 10x growth in data scientists and become a central tool in Canva’s data stack.
Background information
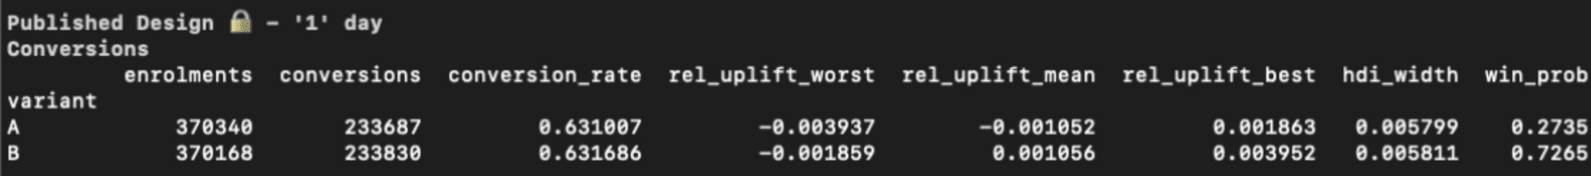
At Canva, experimenting with our product has always been part of our journey. However, it wasn’t until 2019 that our data science specialty developed the first version of our experiment analysis framework: a Python package where any data scientist could define shared metrics and create analysis configurations. We could compute the results and view them through a command line interface.
We immediately had one standardized way to calculate and interpret results across the company. Additionally, the package automatically calculated guardrail metrics, letting us monitor an experiment’s impact on company-wide goals, such as active users or revenue.
This was an amazing first step, but we quickly discovered that sharing screenshots through Slack or Confluence was cumbersome. We captured the results at a point in time, and data scientists had to manually re-process the results whenever a stakeholder asked.
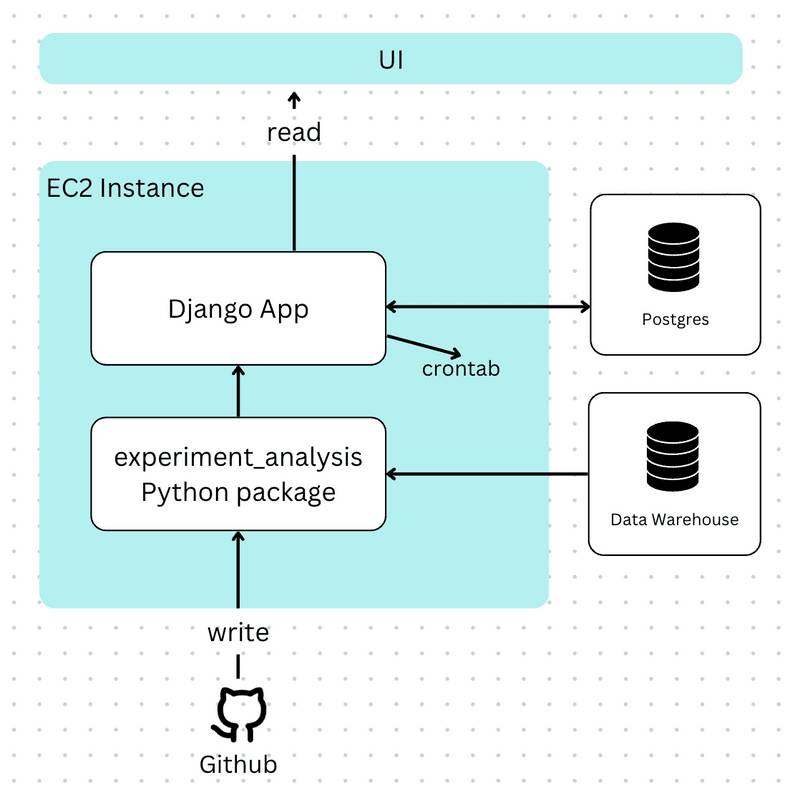
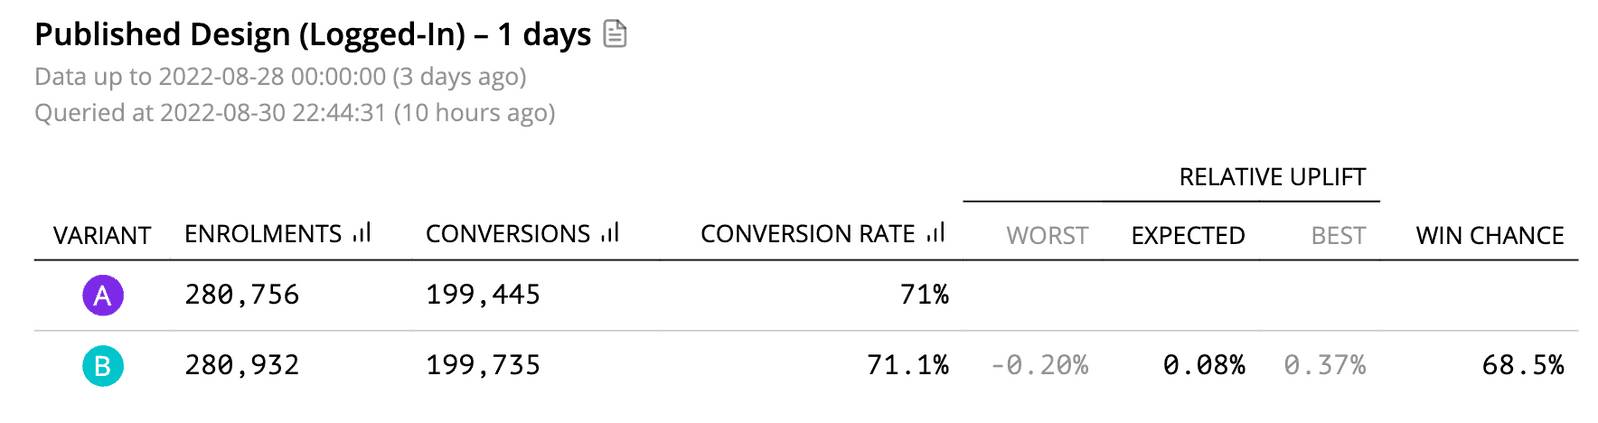
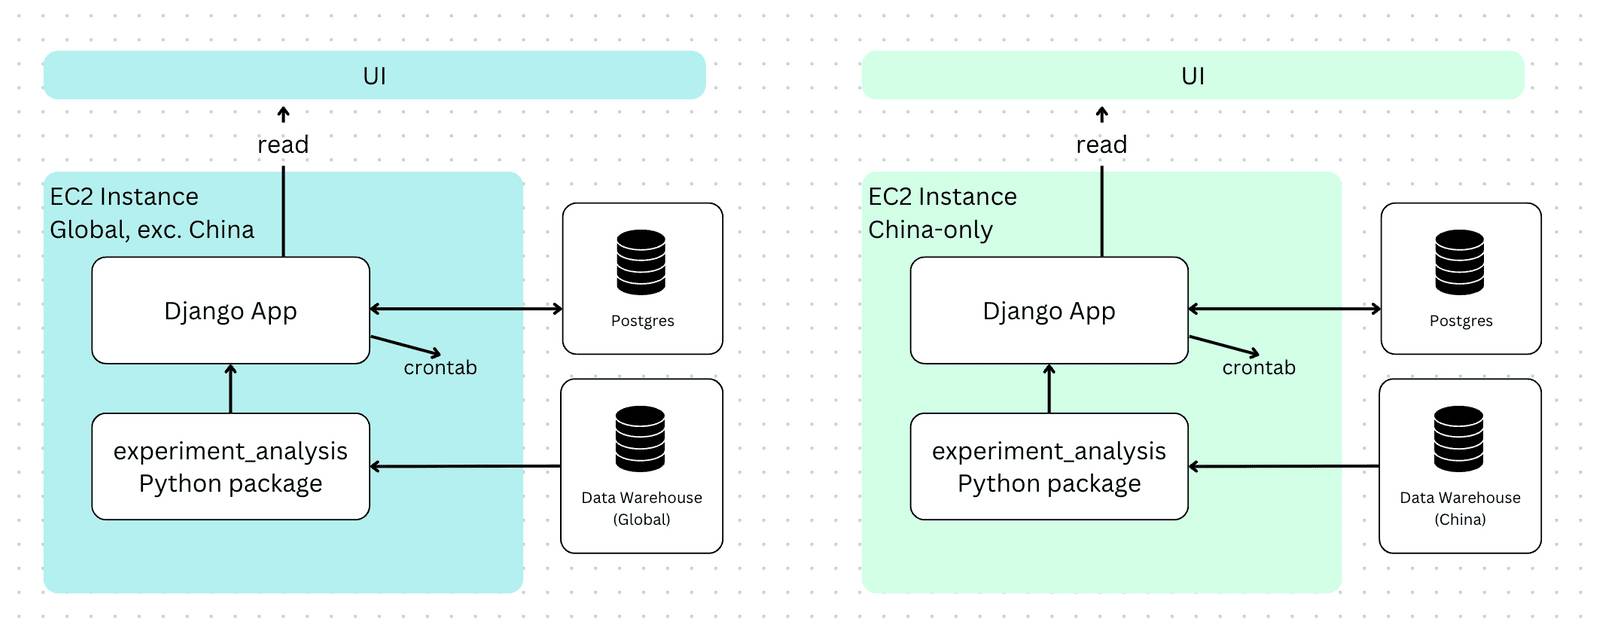
To solve this issue, we created a Django web app to schedule daily updates and provide an interface to share analysis results across the company. We were still creating and storing metrics and analysis configurations in the Python package, but we were now persisting results in a database. Stakeholders could navigate to a UI to see up-to-date results whenever they wanted.
How we presented results on the command line worked pretty well so far, so the way we displayed them in the web app wasn’t drastically different.
Over time, to support our growing China product (canva.cn) and abide by data regulations, we deployed a second instance of the Django app to run in China. Having 2 apps meant that for experiments launched to both canva.com and canva.cn, stakeholders had to visit both apps to view results. Clearly, this wasn’t an ideal situation.
People were starting to feel the growing pains of this system:
- Data scientists spent a lot of time on data entry and analyses configuration. Only those with the right data warehouse credentials could validate and run ad hoc analyses.
- Engineers and product managers couldn’t self-serve and explore why a particular metric wasn’t performing as expected. Instead, they had to meet with their data scientist (if they were lucky enough to have one) and iterate on the data together.
- Onboarding new data scientists was time-consuming and difficult. They had to be familiar with command line tools, GitHub, and YAML file formatting. Incorrectly formatted YAML files meant they also had to learn to read and debug Python error messages. It often took months for a new data scientist to feel comfortable conducting experiment analyses.
- The scale of Canva’s growth meant that the number of analyses continued to grow, straining the system such that results weren’t always up-to-date. Stakeholders were frustrated because they felt blocked by data. Data scientists were frustrated because they had to calculate results outside the platform to enable faster decisions.
Trust in the platform was eroding.
Evolution – Handing it over to Engineering
To this point, the experiment analysis framework had been built and maintained by data scientists independently of our in-house feature flagging and assignment product, Feature Control.
It became clear that to elevate Canva to be a world-class data-driven organization, we needed experiment analyses that were reliable, trusted, and accessible to anyone. So, we passed the framework over to a dedicated engineering team to rewrite and integrate it into Feature Control.
The rewrite resulted in the following improvements:
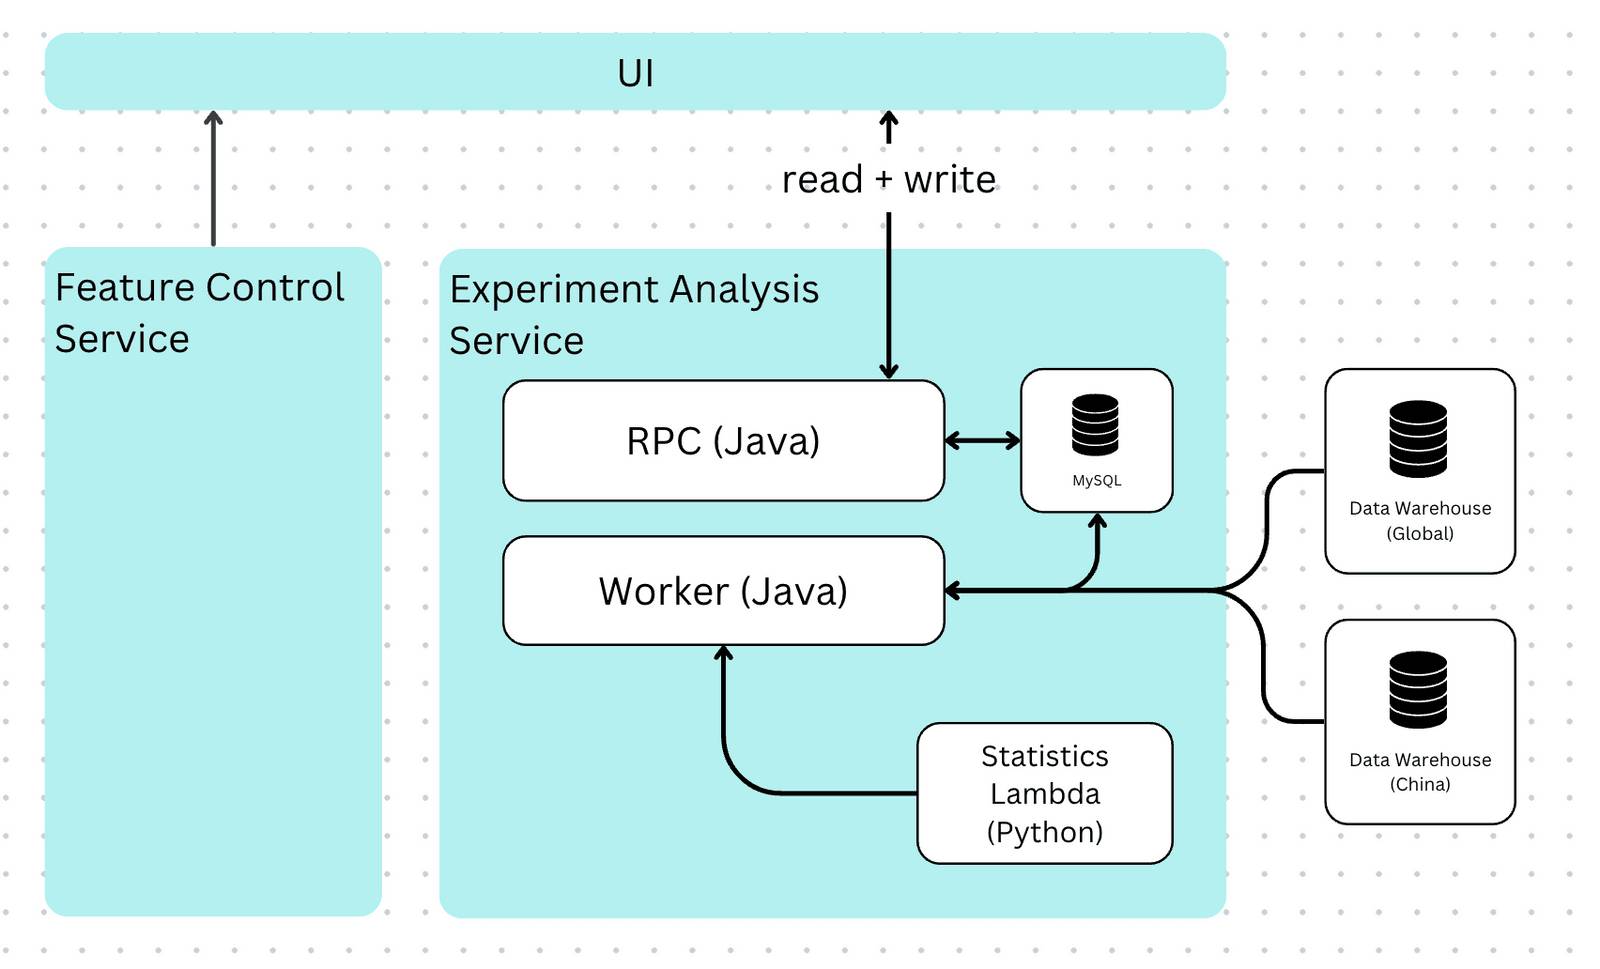
- We create and run analysis configurations on demand through an interface every Canvanaut can access. Anyone in the company can run an experiment analysis and explore their results.
- The entire experimentation user flow, from creating feature flags and assigning users to new features, to looking at the impact for Global and China users, are all in one place. This gives Canvanauts one less tool to worry about and ensures that all Canva users receive the same great product experience.
The new system has many technical highlights too. The first was packaging up experiment statistical models into a Python library, deployed as an AWS lambda. This worked well because Python is inherently superior for statistical modeling, making it easy for data scientists to apply changes to production models. A nice side effect of using a lambda is that it exposes an API for users to call and use for ad hoc analyses outside our platform.
This new architecture also looks like and is written to the quality of a standard Canva product service. It uses the same languages and infrastructure (Javascript, Java, and MySQL), complete with alerts and an on-call roster to ensure minimal downtime.
We also released an education program on the theoretical and practical aspects of experimentation, such as understanding our statistical models, decision-making, and debugging problems. This program was instrumental in empowering Canvanauts to self-serve their data issues and resulted in a drop of over 50% in help requests in our team Slack channel.
Our current architecture
So far, we’ve only built half the foundation of a great experiment analysis platform. The analysis configuration components, such as metrics, are still defined using partial SQL snippets, which we want to write in a very specific way. SQL snippets are flexible and allow quick new metric construction, and worked when data scientists configured the experiment analyses. However, they’re error-prone and almost impossible for non-technical users to write for non-technical users, resulting in overly complex and statistically invalid metrics. SQL snippets don’t scale.
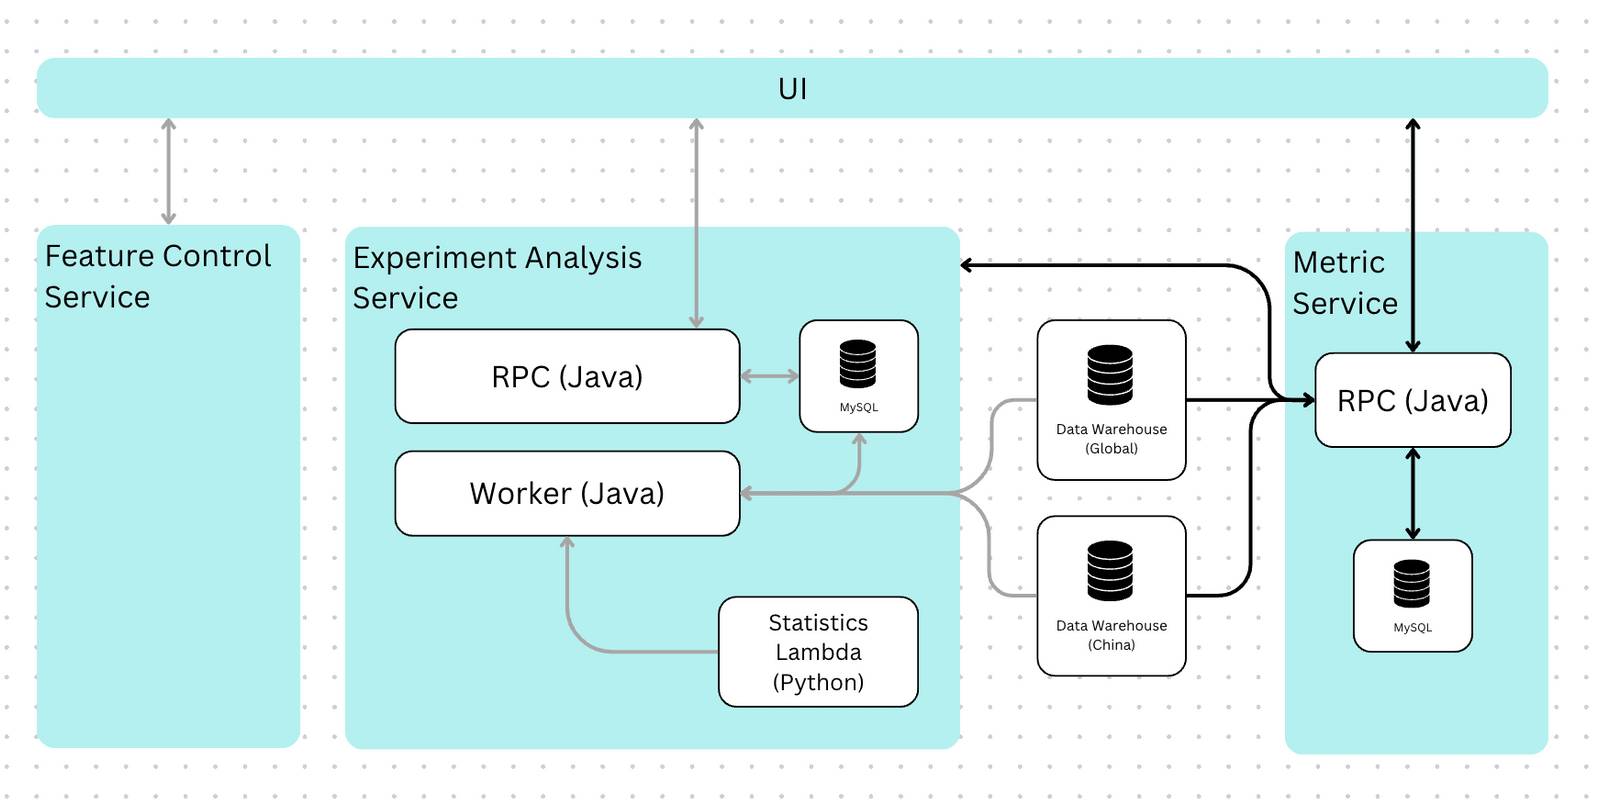
In our most recent milestone, we wanted to make experiment analyses accessible to anyone and encourage everyone to experiment using best practices. To do this, we completely redesigned how users create their experiment analysis components to have a point-and-click interface that abstracts SQL away from most user flows. This approach ensures all metrics are consistent, correct, and statistically valid.
On a technical level, we store and manage these components in a separate microservice. This lets us easily use them in other future applications, such as ad hoc analyses or business intelligence tools.
Final thoughts and where to from here
The experimentation platform at Canva has undergone an incredible transformation in the last few years, and we’ve only just begun. We’re focused on continuing to make experimentation accessible to everyone at Canva. Some of our upcoming projects include streamlining the now-fragmented workflows with experiment setup and experiment analyses, and further improving the learnability of the experiment results within the platform.
Acknowledgements
A big thank you to the current Experiments team for making huge improvements in democratizing experiment analysis. In particular, thanks to the original Feature Control team engineers: Dillon Giacoppo, Kris Choy, Richie Trang, Will Zhou, Tristan Marsh, and Shane Morton for rebuilding the engineering foundations of our experiment analysis platform. Additionally, a special thank you to our data science specialty, who have authored, maintained, and educated the engineering team and broader company on our experiment analysis framework. Your contributions have been invaluable in shaping and advancing our capabilities.