包阅导读总结
1.
关键词:Multi-cloud Monitoring、Grafana Cloud、AWS、Microsoft Azure、Google Cloud
2.
总结:Grafana Cloud 推出 Cloud Provider Observability 应用,可统一监测 AWS、Microsoft Azure 和 Google Cloud 服务,易于设置和扩展,能自动检测服务,提供详细日志视图以改善 MTTR,GCP 和 Azure 由 Grafana Alloy 支持,介绍了获取该服务的步骤。
3.
主要内容:
– Cloud Provider Observability 应用解决多云环境监测难题
– 统一多云监测,扩展自 AWS Observability 应用
– 无需不同工具,降低复杂度和运营成本
– 应用特点
– 易于设置和扩展,提供全面的抓取指令
– 自动检测服务,无需手动操作
– 提供详细日志视图,改善解决问题效率
– 支持的服务
– Azure:包括 SQL 数据库等
– Google Cloud:包含 Cloud SQL 等
– AWS:涵盖 CloudFront 等
– 获取方式
– 按步骤进行设置和配置
– 利用自动服务发现
– 通过新导航项访问
– 借助预配置仪表板监测和解决问题
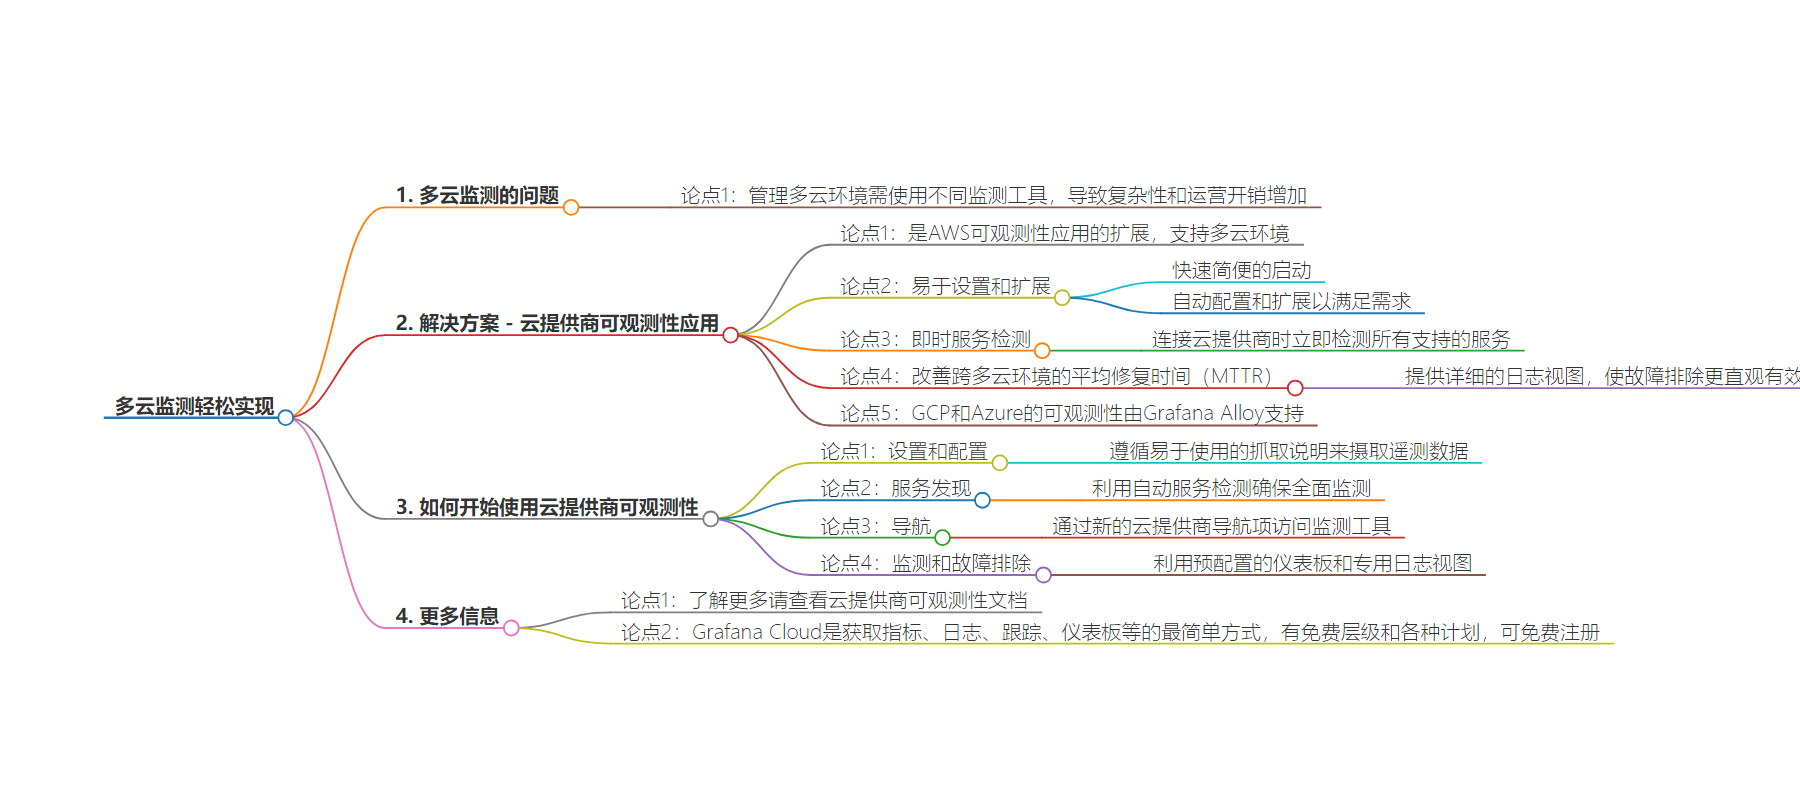
思维导图:
文章来源:grafana.com
作者:Vasil Kaftandzhiev
发布时间:2024/8/22 14:23
语言:英文
总字数:623字
预计阅读时间:3分钟
评分:83分
标签:多云监控,Grafana 云,AWS,微软 Azure,谷歌云
以下为原文内容
本内容来源于用户推荐转载,旨在分享知识与观点,如有侵权请联系删除 联系邮箱 media@ilingban.com
Managing multi-cloud environments often means juggling different monitoring tools for each provider, leading to increased complexity and operational overhead. To solve for that, we’re excited to introduce Cloud Provider Observability — an application for monitoring AWS, Microsoft Azure, and Google Cloud services, all in Grafana Cloud.
The Cloud Provider Observability application (which is in public preview) is an extension of our AWS Observability app, offering expanded support for multi-cloud environments. You can now unify multi-cloud monitoring efforts with a single, out-of-the-box solution that integrates seamlessly with AWS, Azure, and Google Cloud.
Easy to set up and scale
Getting started with Cloud Provider Observability is quick and straightforward. The app provides comprehensive scraping instructions, enabling you to start ingesting cloud provider telemetry without any extra work. Whether you’re dealing with AWS’s Elastic Load Balancing, Azure SQL Databases, or Google Cloud Storage, the app automatically configures and scales to meet your needs, so you can focus on more critical tasks.
Instant service detection
When you connect to any of these cloud providers, Grafana Cloud immediately detects all supported services. This feature eliminates the need for manual effort, saving you time and ensuring your services are monitored from the moment they are deployed.
Here is a full list of currently supported services per cloud provider:
Supported services in Azure
- Azure SQL Database
- Azure SQL Elastic Pool
- Azure Virtual Network
- Azure Service Bus
- Azure Event Hubs
Supported services in Google Cloud
- Google Cloud SQL
- Google Cloud Pub/Sub
- Google Cloud VPC
- Google Cloud Storage
Supported services in AWS
- Amazon CloudFront
- Amazon EBS
- Amazon ECS
- AWS ELB Application Load Balancer
- AWS ELB Classic Load Balancer
- AWS Lambda
- AWS NAT Gateways
- Amazon RDS
- Amazon S3
- Amazon SES
- Amazon SQS
- AWS VPN
Improve MTTR across multi-cloud environments
Cloud Provider Observability also offers detailed log views designed to make troubleshooting more intuitive and effective. Logs are displayed in a clear, actionable format that helps reduce mean time to resolution (MTTR), which is crucial in multi-cloud environments where issues can span across different providers.
GCP and Azure observability, powered by Grafana Alloy
For Google Cloud and Azure users, the Cloud Provider Observability app leverages Grafana Alloy — our open source OpenTelemetry collector with built-in Prometheus pipelines and support for metrics, logs, traces, and profiles — providing actionable insights for managing metrics and logs.
We’re currently working towards feature parity with our AWS offerings, and will soon include the same serverless and agentless options that our AWS customers appreciate for GCP and Azure.
How to get started with Cloud Provider Observability
- Setup and configuration: Follow our easy-to-use scraping instructions to begin ingesting telemetry data from your cloud providers. The process is designed to be as seamless as possible, with out-of-the-box dashboards that offer immediate insights.
- Service discovery: Utilize the app’s automatic service detection to ensure comprehensive monitoring from day one. This feature continuously scans for new services and integrates them into your monitoring dashboards automatically.
- Navigation: Access all your cloud monitoring tools via the new Cloud provider navigation item in Grafana Cloud, simplifying the user experience.
- Monitoring and troubleshooting: Leverage pre-configured dashboards for efficient troubleshooting, and use the dedicated log views to quickly identify and resolve issues.
Learn more about multi-cloud monitoring in Grafana Cloud
Cloud Provider Observability in Grafana Cloud simplifies monitoring multi-cloud environments and provides more comprehensive insights across your services. With its unified monitoring capabilities, easy setup, automatic service detection, and dedicated log views, this solution empowers your team to manage complex, multi-cloud environments with confidence and efficiency.
To learn more, check out our Cloud Provider Observability documentation.
Grafana Cloud is the easiest way to get started with metrics, logs, traces, dashboards, and more. We have a generous forever-free tier and plans for every use case. Sign up for free now!
