
包阅导读总结
1. 关键词:Rider 2024.2、Unreal Debugging、Native Debugger、Improvements、Performance
2. 总结:Rider 2024.2 在原生调试器方面对 Unreal 调试有大量改进,包括视图优化、评估改进、模块视图支持、数据断点改进等,未来还有更多规划。
3. 主要内容:
– Rider 2024.2 对 Unreal 调试的原生调试器改进
– 可在调用栈中查看蓝图
– 能过滤显示引擎的 C++ 帧
– 评估改进
– 正确评估 STL 和 Unreal 智能指针等的操作符
– 支持比较字符串字面量与特定字符串类型
– 改进优化代码的评估
– 支持模块视图
– 展示加载的.dll 或.so 文件等
– 数据断点改进
– 更响应和可靠,适用更多场景
– 未来规划
– 更多性能优化
– 更好支持进程分离
– 改进代码评估
– 原生调试器增加步时可视化
– 引入.NET 调试器的集合可视化工具
– 推进游戏主机调试支持
思维导图:
文章地址:https://blog.jetbrains.com/dotnet/2024/08/12/unreal-debugging-improvements-in-rider-2024-2/
文章来源:blog.jetbrains.com
作者:Matthias Koch
发布时间:2024/8/12 14:55
语言:英文
总字数:1033字
预计阅读时间:5分钟
评分:85分
标签:调试,虚幻引擎,Rider,JetBrains,本地代码
以下为原文内容
本内容来源于用户推荐转载,旨在分享知识与观点,如有侵权请联系删除 联系邮箱 media@ilingban.com
Unreal Debugging Improvements in Rider 2024.2
Rider 2024.2 includes massive improvements to the native debugger, significantly improving the experience of evaluating native code while debugging. There are performance improvements, better handling of optimised code, and support for evaluating operators on smart pointers and string types. The changes will make a big difference to your day-to-day debugging of Unreal games with JetBrains Rider. Let’s take a look at some of the details.
View Blueprints in callstack
It can sometimes be tricky to know exactly where your code is being called from, especially if the callstack just shows anonymous memory addresses. Fortunately, Rider can help here, by resolving those memory addresses to Blueprint frames, and showing you which Blueprint your code is being called from. This feature first appeared in 2024.1, but has had a few updates in the new release. It’s really helpful when Rider can tell you how your code is being used!
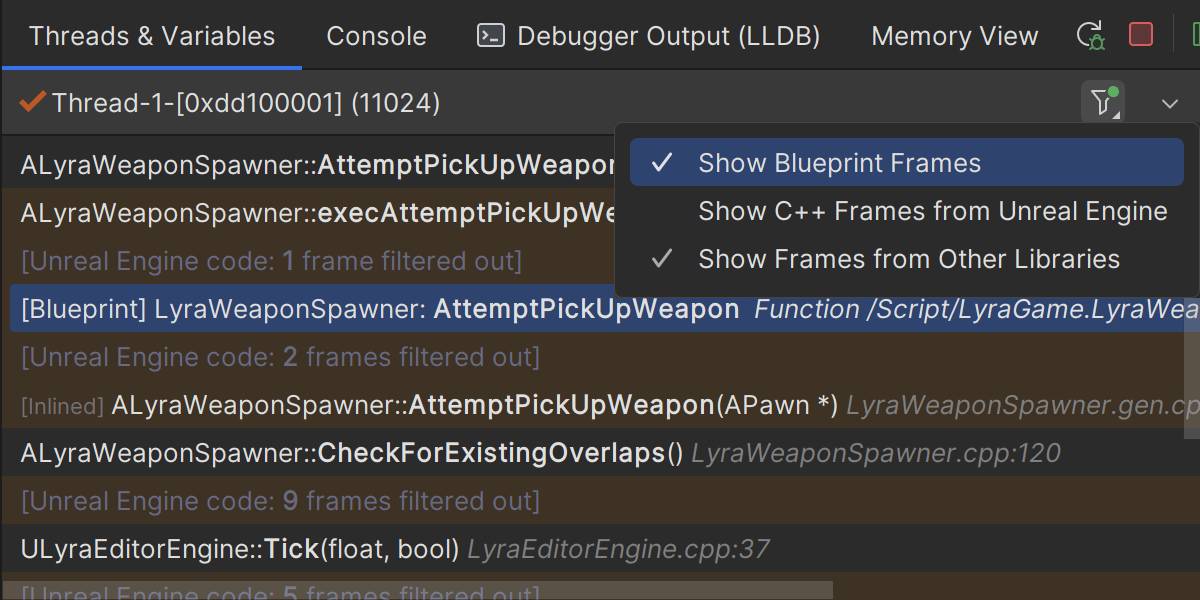
You’ll notice in the screenshot that there’s another option in the filter drop-down menu. The Show C++ Frames from Unreal Engine option allows you to show or hide the frames from the engine, so you can ignore some of the massive call stacks from the engine, and concentrate on your code.
Evaluation improvements
The most significant updates in Rider 2024.2 are the improvements to evaluation in the debugger. We’ve addressed a large number of the most pressing issues with native code evaluation, and these changes should have a dramatic effect on your quality of life when using Rider’s debugger. Let’s dive in!
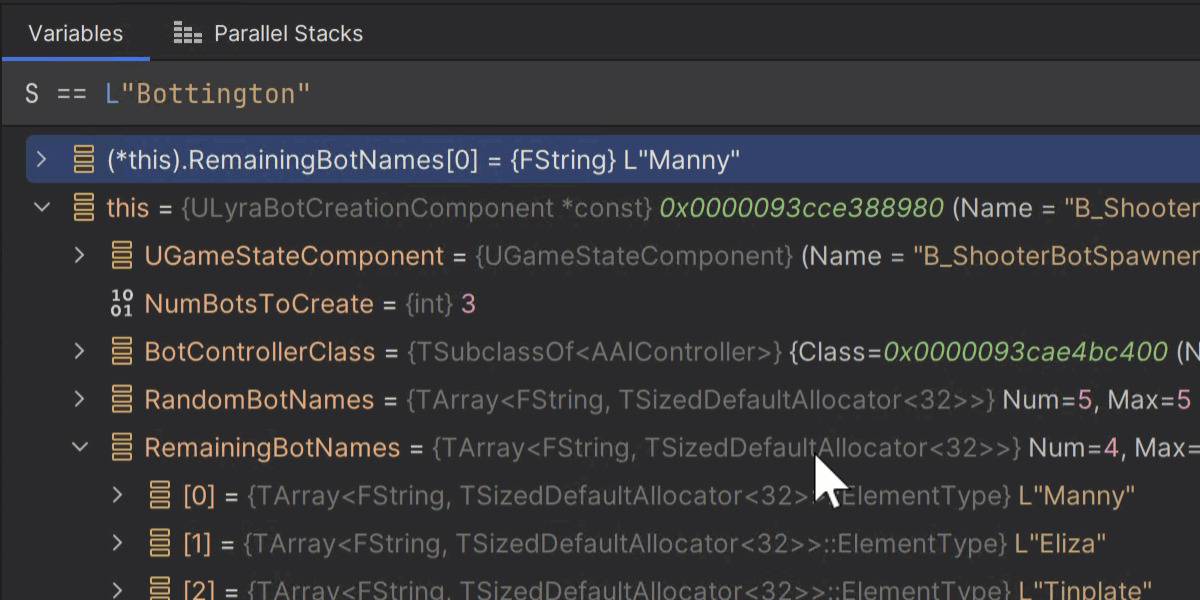
Firstly, Rider will now correctly evaluate operators on STL and Unreal smart pointers, collection containers, and strings. In other words, given the Unreal smart pointer TSharedPtr or TObjectPtr, it’s now possible to use the arrow operator -> to access members of the underlying pointer, or to dereference the object with the * operator. You can also use the !, != and == operators, just as you’d expect.
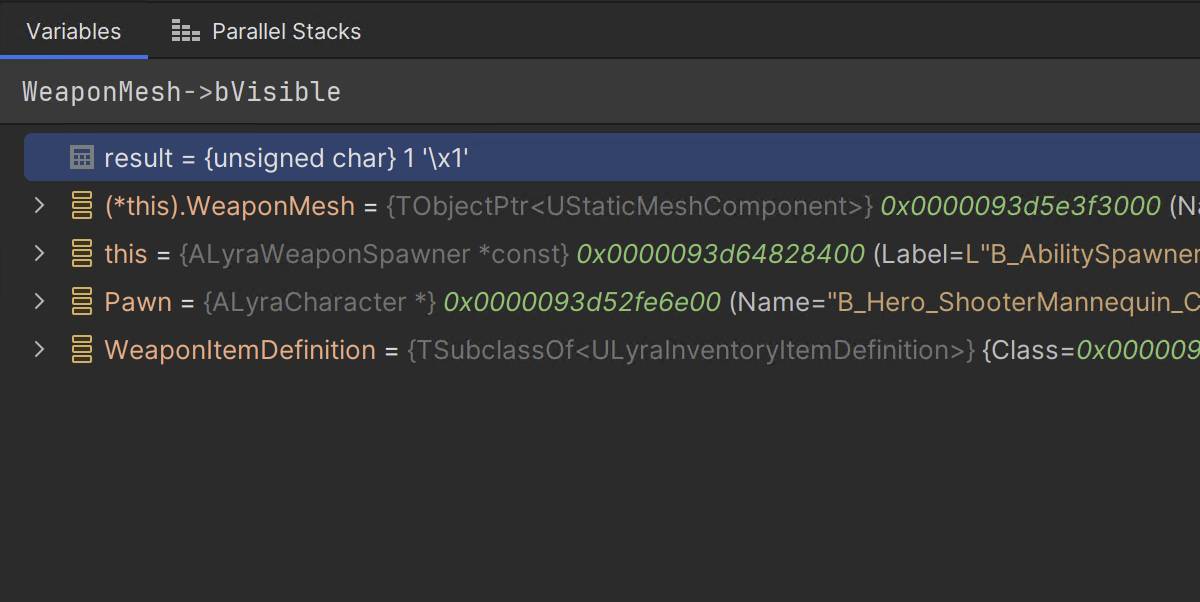
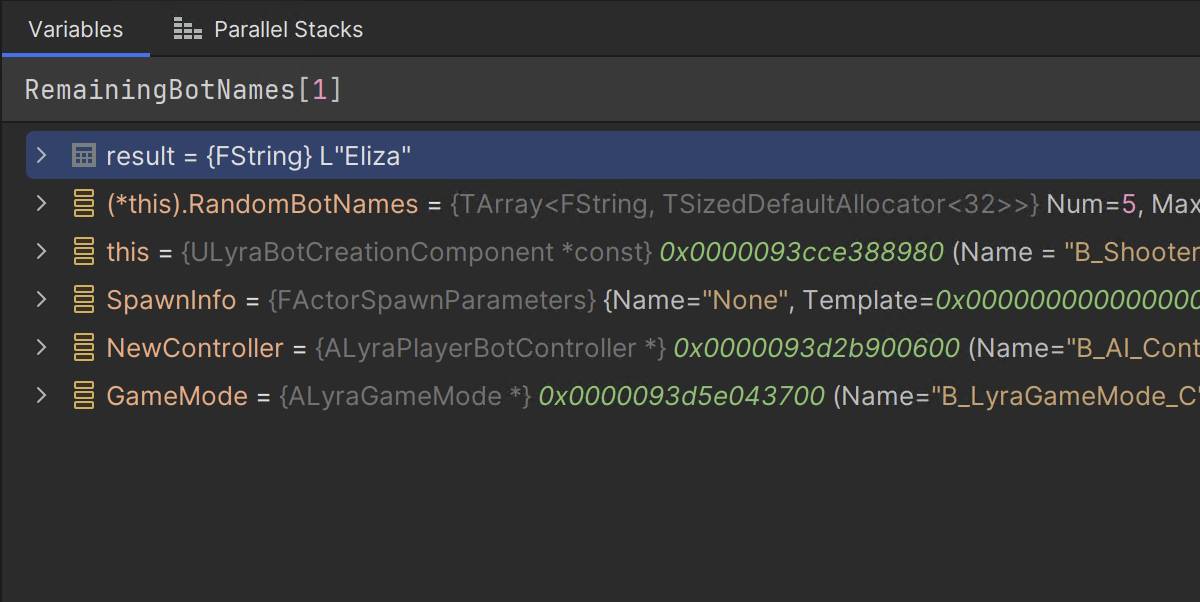
You can also use the [] operator to access elements of array-like containers, such as TArray.
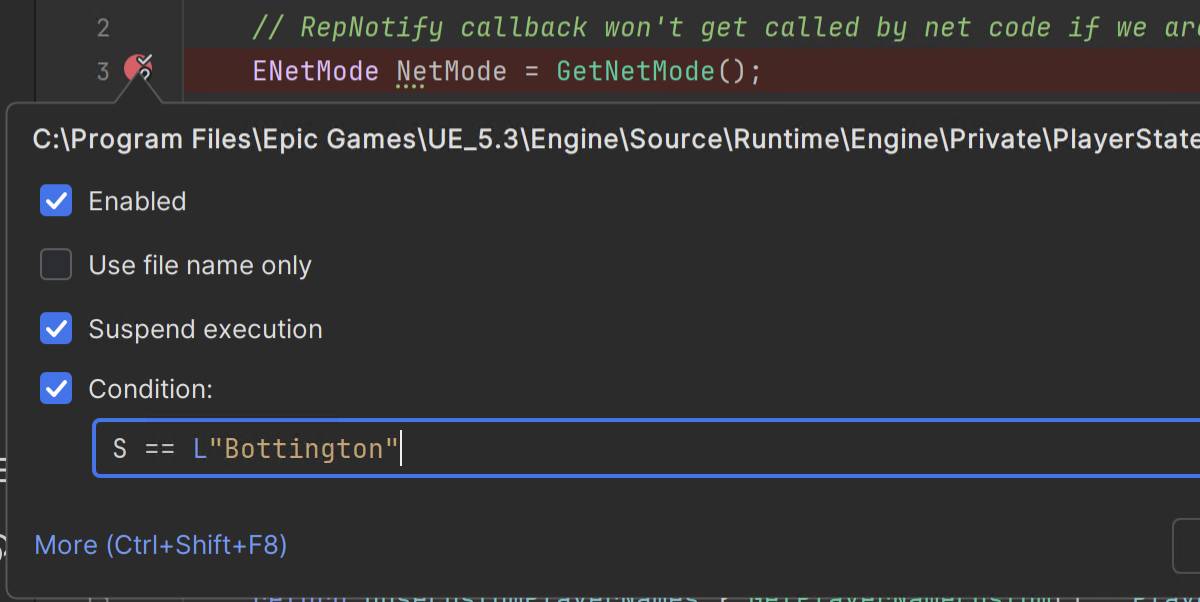
Rider now supports the == and != operators to compare string literals against string types such as std::string, std::wstring, and FString.
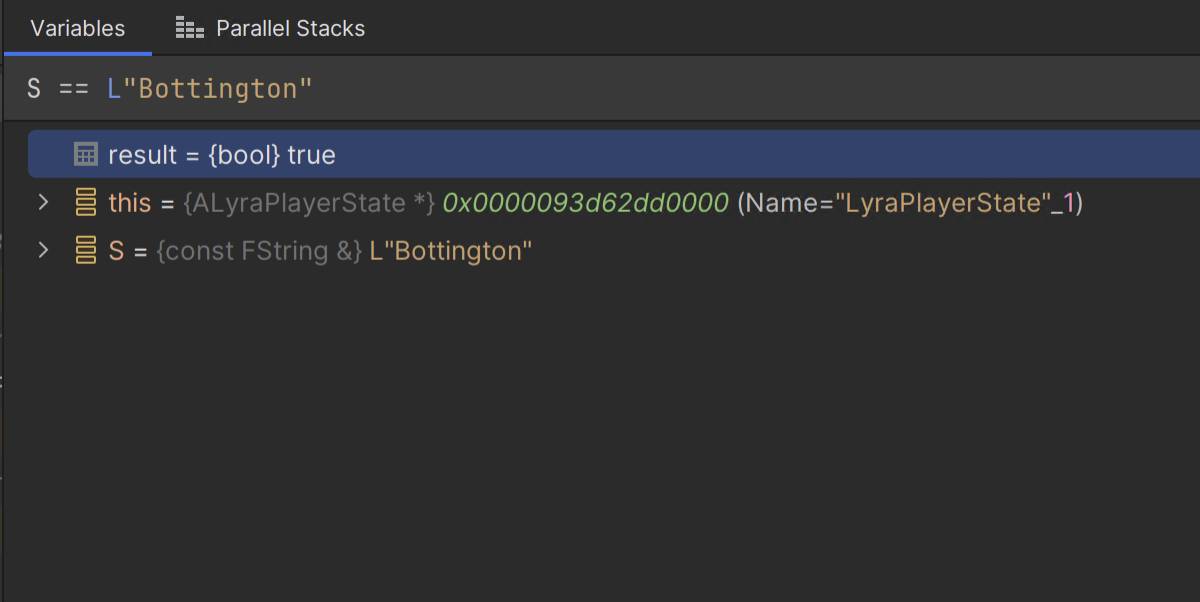
Furthermore, all of these operators can be used not just in evaluation and watches, but as conditions in a conditional breakpoint.
Another huge quality of life improvement is that the Add to Watches action now works much more reliably, and in many more scenarios. When looking at an object in the debugger, you’re typically looking at a custom, user-friendly view of the object provided by the Natvis framework. For example, instead of showing the internal values of an STL or Unreal container, the debugger can show the items inside the container, showing the data you’d expect. This custom view means it is very complex to add a custom watch to one of these synthetic object members, but Rider 2024.2 now generates the correct expression when right-clicking to add a watch.
This release also improves evaluation for optimised code. The compiler can optimise away huge chunks of data, which can make it harder to understand the current context while debugging. But the compiler doesn’t always optimise away entire objects – only data that isn’t being used. Rider can now show objects with partial data, providing much more context to help you debug. And when data or objects aren’t available, the sometimes cryptic internal error messages have been replaced with more friendly text that explains why all or part of an object can’t be shown.
Modules view
Rider 2024.2 brings support for the Modules view to the native debugger. This feature was first introduced in Rider 2023.3 for .NET, and it now works with your Unreal games, too. The Modules view is a new tab in the Debug tool window that shows a list of all the loaded .dll or .so files, along with details of the path, and if the module has loaded symbols.
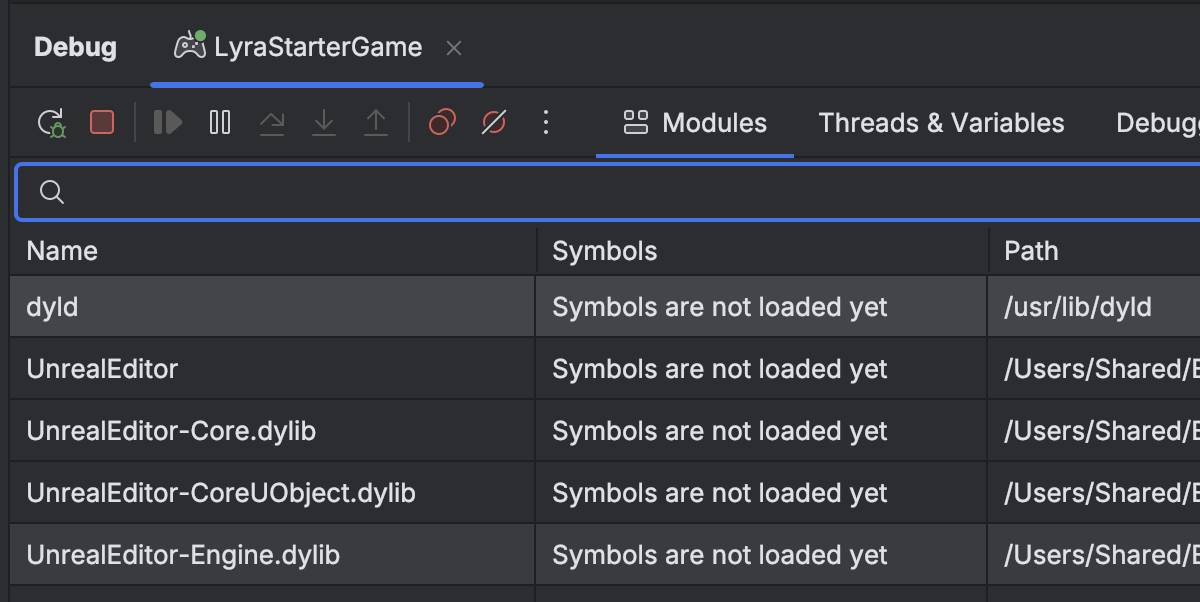
You can right click on a module and copy the module’s name or path, or navigate to the module location on disk.
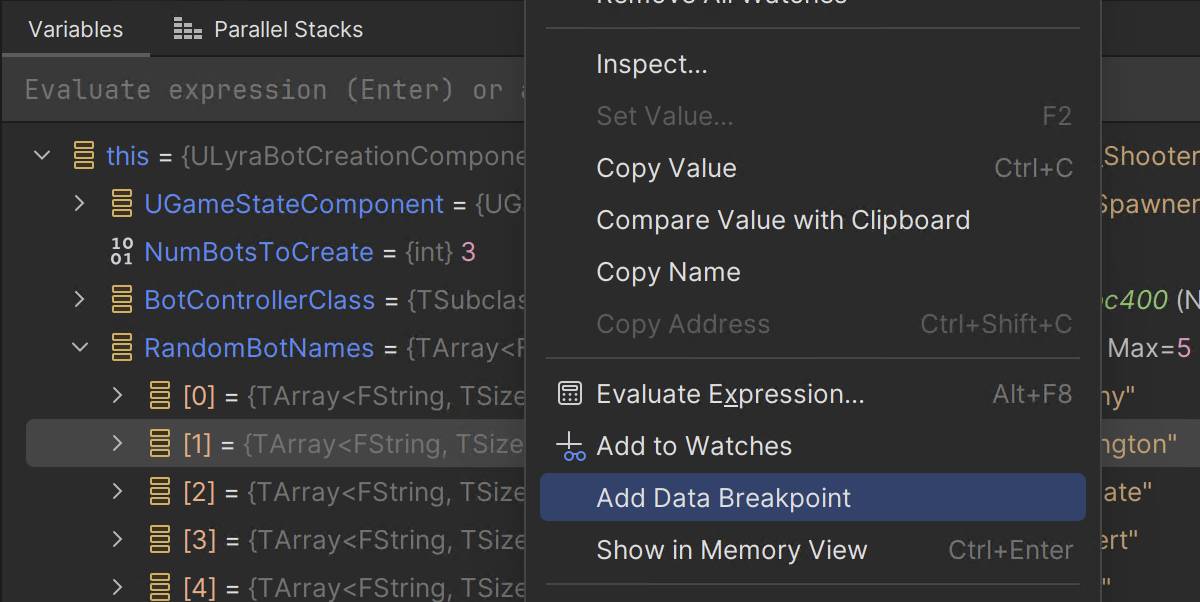
Data breakpoints
We’ve also made significant improvements to data breakpoints in this release, making them much more responsive and reliable. They now work in many more scenarios than before, including on items generated from Natvis files, and will show a useful error message if there are problems. If you’re not already familiar with data breakpoints, check out the documentation. They are a great feature that will suspend execution when a value changes, such as an integer or pointer, which can be a very powerful way to debug complex behaviour.
Roadmap
The paint on Rider 2024.2 is barely dry, and yes, we’re already talking about the roadmap! We’ve got lots more planned over the next few releases for the native debugger and Unreal debugging in general. Specifically, we’re looking at more performance optimisations, better support for detaching from processes, and even more work on improving code evaluation.
We also want to bring stepping time visualisation to the native debugger, like Rider already does for .NET. Rider will show an inline hint while debugging, letting you know how long it takes to execute your code between two breakpoints, or when stepping over single lines of code. This can help you spot when a section of code is taking longer than expected, and might indicate a performance issue that you want to investigate further.
Another feature we want to bring from the .NET debugger is the collections visualiser, which provides a rich interface for inspecting, sorting, and filtering collections of objects.
And finally, we’re making great progress on debugging support for games consoles, and look forward to sharing that in future releases.
There are lots of great improvements to the native debugger in Rider 2024.2, we encourage you to upgrade and try it for yourself on your own projects.
For more information on game development in Rider, check out the recording of this livestream on how Rider’s AI Assistant can help with understanding a codebase, dealing with boilerplate, and learning APIs and frameworks.