
包阅导读总结
1.
关键词:Grafana Cloud、AI/ML、Observability、Anomalies、Workflows
2.
总结:Grafana Cloud 利用 AI/ML 工具使可观测性更简单,包括 Sift 调查用于识别异常和解决问题,预测和异常检测功能,以及 Grafana LLM 插件简化工作流程,其目的是让团队更高效处理服务和问题。
3.
– Grafana Cloud 的 AI/ML 工具
– Sift 调查
– 利用机器学习帮助团队识别异常和调查问题。
– 提供自动检查和错误解释。
– 可在多个工作流中启动和触发。
– 预测异常
– 包括预测和异常检测功能。
– 预测可从历史数据学习并预测未来值,帮助容量规划和自动缩放。
– 异常检测可监控服务组并识别异常表现。
– Grafana LLM 插件
– 帮助更快理解火焰图。
– 一键总结事件。
– 为仪表盘生成标题和描述。
思维导图: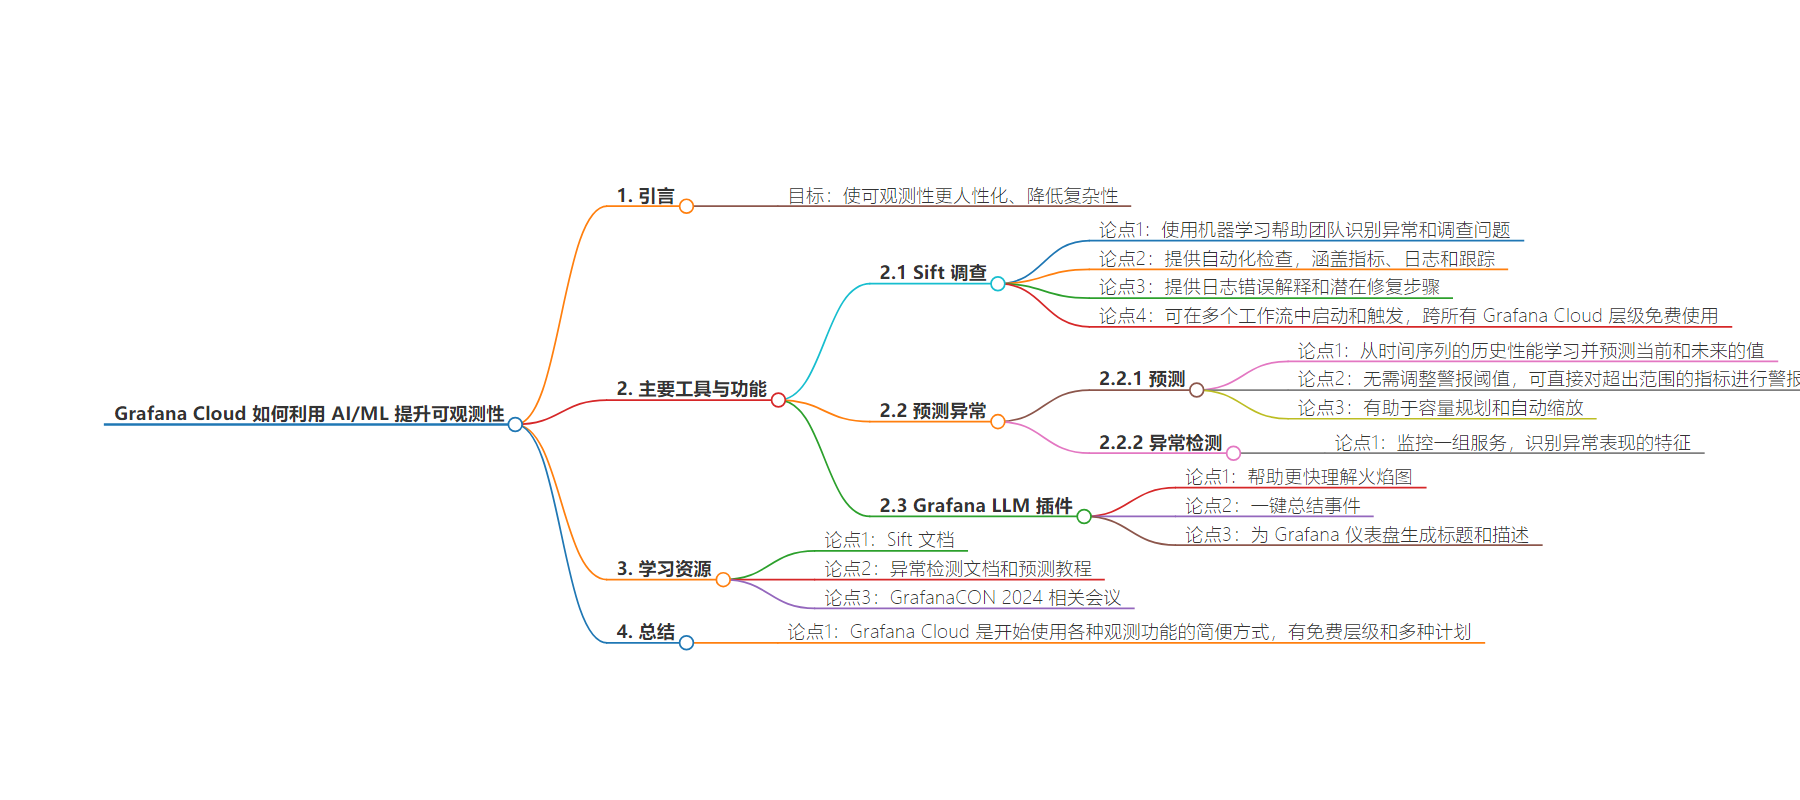
文章来源:grafana.com
作者:Michelle Tan
发布时间:2024/7/2 20:30
语言:英文
总字数:715字
预计阅读时间:3分钟
评分:88分
标签:ai-ml,sift,插件,集成,grafana-cloud
以下为原文内容
本内容来源于用户推荐转载,旨在分享知识与观点,如有侵权请联系删除 联系邮箱 media@ilingban.com
At Grafana Labs, our No. 1 approach when building AI/ML tools is to enable humans (a.k.a. all of us!) to understand complex systems. In other words, we want to make observability still human, but less complicated. (Our second use case? Making social media more fun.)
We believe that AI/ML tools in observability should work towards minimizing toil and the need for everyone in your organization to have the same deep domain knowledge about your increasingly complex stack.
After all, AI/ML should ultimately make it easier and less stressful for teams to run your services and to help you find and resolve issues effectively and efficiently — sometimes even before they impact users. Here’s how we do that in Grafana Cloud.
Learn why your system isn’t working: Sift investigations
Something wrong in your application? Sift is a diagnostic tool that uses machine learning to help teams identify anomalies and investigate issues. It reduces toil and speeds up response times by offering:
- Automated checks across metrics, logs, and traces to uncover anomalies in logs, patterns in your HTTP errors, slow requests via traces, and more.
- Explanations of log errors that summarize anomalies and offer potential fixes in easy-to-follow steps.
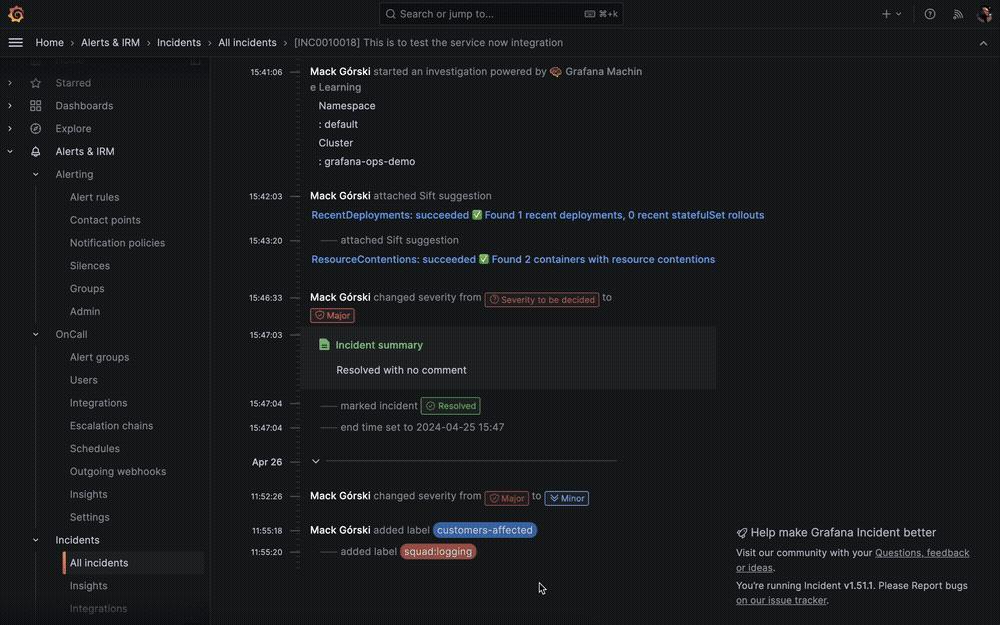
You can start a Sift investigation anywhere in Grafana Cloud, including in your dashboards and Explore, and run Sift across many workflows. You can also trigger Sift automatically from Grafana Incident, which automates the time-consuming tasks of incident management so you can actually fix the issue faster, and Grafana OnCall, our on-call management tool that integrates with all parts of the Grafana LGTM Stack.
Best of all? Sift is available across all Grafana Cloud tiers at no additional cost.
Learn more in our Sift documentation.
Predict anomalies: Forecasting & outlier detection

These features tell you when your system is not healthy — now and in the future. Forecasting and outlier detection in Grafana Cloud help you learn the expected values of metrics over time and apply dynamic alerting to predict and detect anomalies.
Forecasting
With forecasting in Grafana Cloud, you can learn from the historical performance of a time series and predict values for your current usage and in the future. Instead of tuning thresholds on alerts, you can simply alert on when a metric is out of bounds. You can also capture daily and weekly seasonality to help set thresholds for peak and off-peak hours.
Forecasting also helps you with capacity planning and autoscaling so you can look into the future and confidently predict what your usage will look like in a week or a month.
Outlier detection
With outlier detection, you can monitor a group of services and identify when a feature is not performing at the same level as the others. (Cue the memory leaks, noisy neighbors, and other headaches.)
To learn more, check out our outlier detection documentation and our forecasting tutorial.
Simplify your workflows (and your life): Grafana LLM plugin
When your observability stack produces a ton of data, sometimes you just need to get to the point. By adding the Grafana LLM plugin to your stack, here’s how you can do just that:
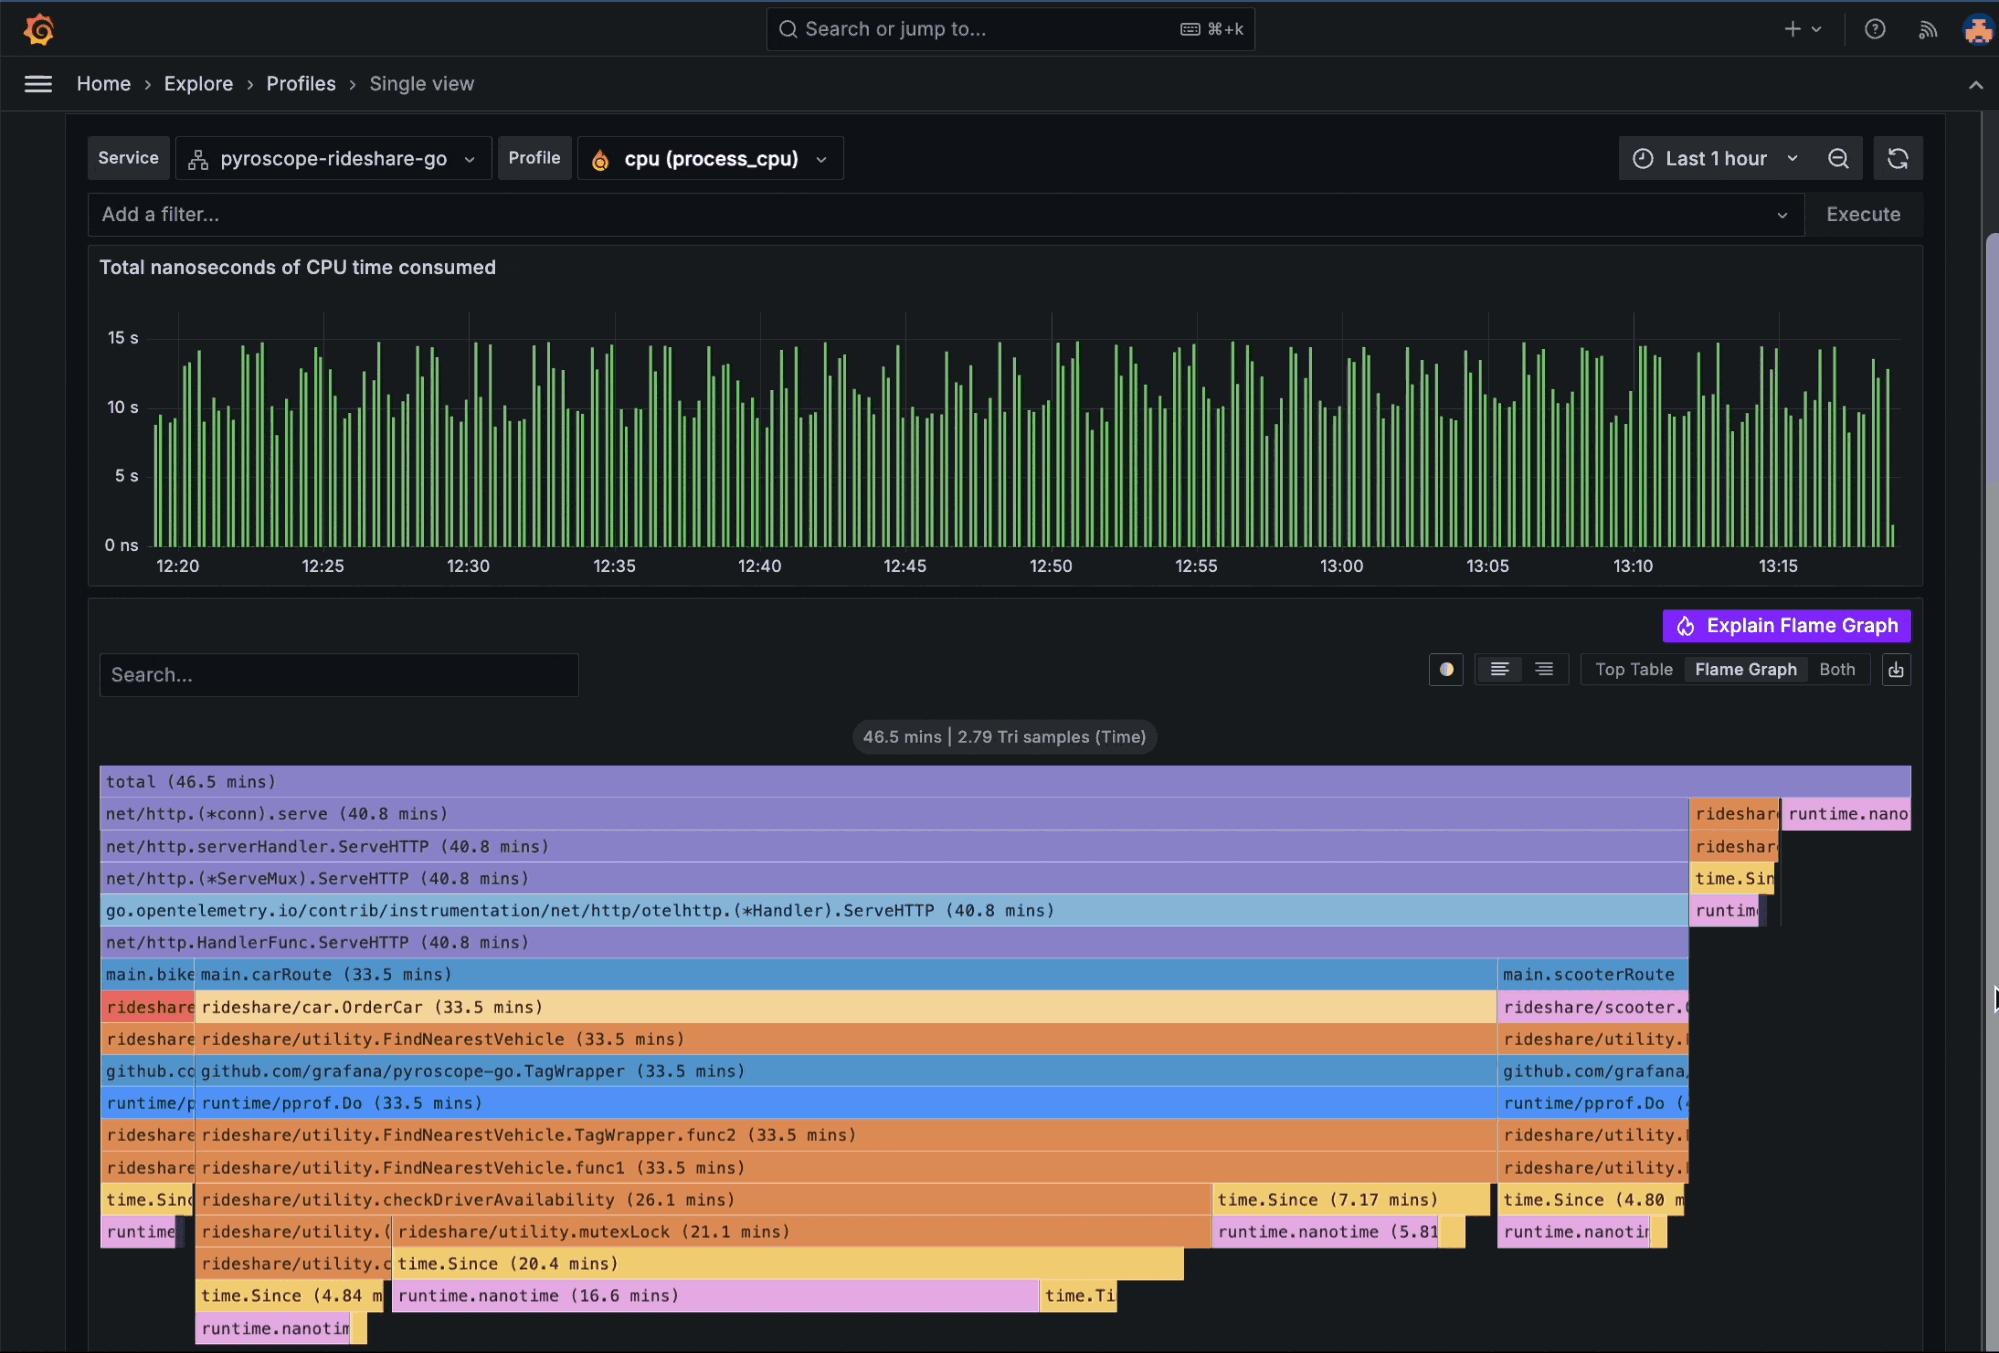
Understand flame graphs faster
Flame graph AI uses LLM to assist with flame graph data interpretation so you can identify bottlenecks, root causes, and suggested fixes faster.
Summarize incidents in one click
The OpenAI integration automatically generates concise, actionable summaries of incidents. This analysis not only captures the essence of the incident quickly but also helps teams ensure no critical details are overlooked when documenting and communicating incident impacts.
AI-generated titles and descriptions for Grafana dashboards
No more wondering how to summarize all the data you packed into your dashboard in one title. Grafana includes a new AI-powered tool that automatically summarizes the information in your panels and dashboards and creates detailed titles and descriptions for your dashboards.
Learn how to enable the Grafana LLM plugin — and get started with all of these tools and more — in your Grafana Cloud stack today.
To learn more about AI/ML and Grafana, check out our GrafanaCON 2024 session “AI/ML + Grafana: How to create intelligent Grafana apps leveraging LLMs” available on demand now.
Grafana Cloud is the easiest way to get started with metrics, logs, traces, dashboards, and more. We have a generous forever-free tier and plans for every use case. Sign up for free now!