包阅导读总结
1. 关键词:移动应用、客户端监测、网络请求、后端监测、网络性能
2. 总结:本文强调移动应用客户端网络监测的必要性,指出仅依赖后端监测存在诸多不足,包括无法全面了解网络请求情况、无法获取部分关键指标等,从多个方面阐述了客户端监测的重要性。
3. 主要内容:
– 客户端监测对移动应用的重要性
– 多数移动应用依赖网络请求提供良好用户体验,但许多团队仅依赖后端监测,此视角不完整甚至可能错误
– 后端监测的不足
– 部分请求未达后端服务器
– 无网络连接
– 连接中断
– DNS 解析失败
– 后端服务器可能拒绝请求
– SSL 握手失败
– 服务器因请求量过大而拒绝
– 部分请求并非针对后端服务器
– 部分指标从后端视角不可得
– DNS 查找时间
– 连接建立和响应传输
– 请求排队时间
– 并非所有请求响应都能到达移动应用
– 移动应用未必能处理所有响应
– 客户端监测的优势
– 能洞察第三方服务的网络行为
– 能测量真实的响应时间等关键指标
思维导图: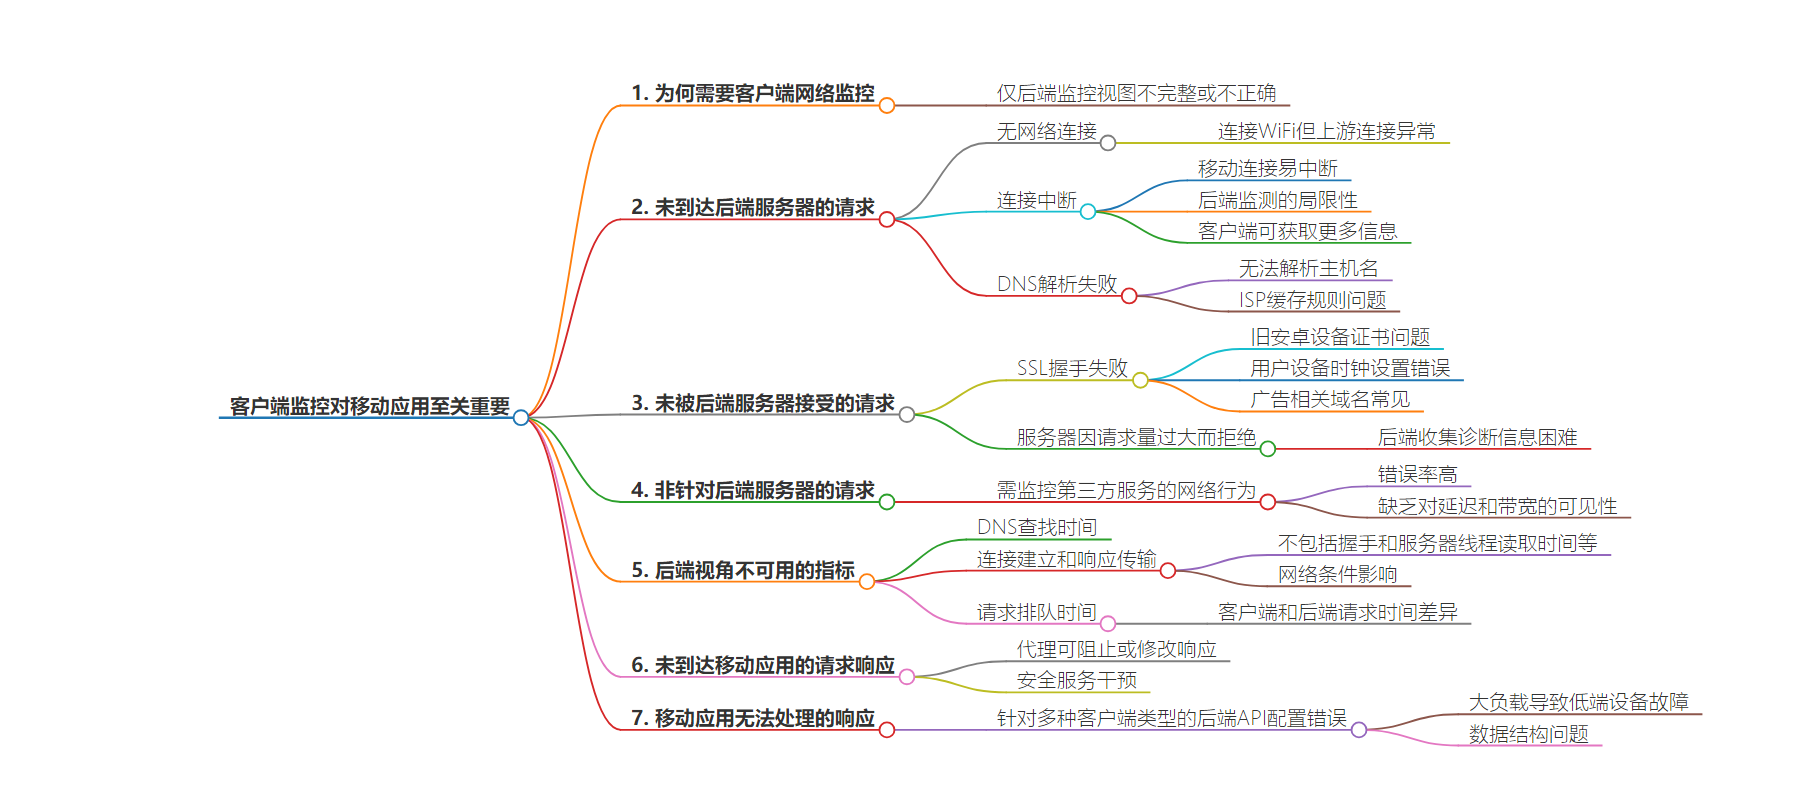
文章地址:https://thenewstack.io/why-your-mobile-app-needs-client-side-network-monitoring/
文章来源:thenewstack.io
作者:Fredric Newberg
发布时间:2024/8/1 13:33
语言:英文
总字数:2478字
预计阅读时间:10分钟
评分:87分
标签:移动应用开发,网络监控,用户体验,性能优化,DNS问题
以下为原文内容
本内容来源于用户推荐转载,旨在分享知识与观点,如有侵权请联系删除 联系邮箱 media@ilingban.com
The vast majority of mobile applications rely on making network requests to deliver a successful user experience. However, many engineering teams do not have client-side network monitoring. Instead, they rely exclusively on backend monitoring to understand where network failures are happening across their systems.
This gives you an incomplete, and possibly incorrect, view of what your mobile users are experiencing. Read on to learn why client-side network monitoring is so important and what you are missing if your only visibility into network performance is from a backend perspective.
Not All Requests Make It to Your Backend Servers
Your backend can only measure the behavior of network requests that actually reach your servers. Below are a few reasons why requests would fail to make it there.
No Internet Connection
There are scenarios where it is not obvious to mobile users that they don’t have a connection. For example, a user can be connected to a WiFi access point, but the upstream connection from the access point is down or has intermittent connectivity.
Interrupted Connection
Even if you initially make a successful connection to a backend server, there’s no guarantee that the request will complete successfully. This is more common with mobile apps than queries made from PCs since mobile connection quality is more dynamic and prone to interruptions or degradations. While backend monitoring may catch this behavior, it’s not an issue that you’d normally prioritize. And even if you did, the server that lost the connection will not have any context about what caused the interruption. On the client side, you can see if anything happened, for example, an unsuccessful switch from WiFI to WAN, and if other network connections made around the same time also failed.
DNS Resolution Failures
If the app can’t resolve a hostname, it won’t be able to make a connection to your backend servers. And, while less common, ISPs can ignore caching rules for DNS entries and cache data for days or even weeks. When you make changes to your DNS settings, you expect downstream consumers of your DNS entries to respect the time to live (TTL) you set, but there is nothing to prevent them from ignoring the TTL. This means devices running your mobile app would resolve hostnames to IP addresses that may no longer be in use.

Requests failing with UnknownHostException after DNS misconfiguration.
Not All Requests Are Accepted by Your Backend Servers
Even if your application can connect to your backend servers, the servers may reject the connection for a variety of reasons.
Failed SSL Handshakes
This is especially common for older Android devices that have expired root certificates with no viable fallback. Another common failure case is when the user sets the clock on their device so far into the future that your SSL certificate no longer appears valid (gotta get those extra lives in games that hand them out after a certain delay!). Perhaps data collection on your servers provides some visibility into this, but this data can often be harder to capture from commonly used proxy servers such as NGINX. Even if you can detect it, you will not have much information about who it happened to since the secure connection could not be established.
This type of error happens frequently for ad-related domains. On one recent day that we analyzed, seven major advertising companies had SSL failures for over 1% of the network requests made to their domains, spread over hundreds of applications.
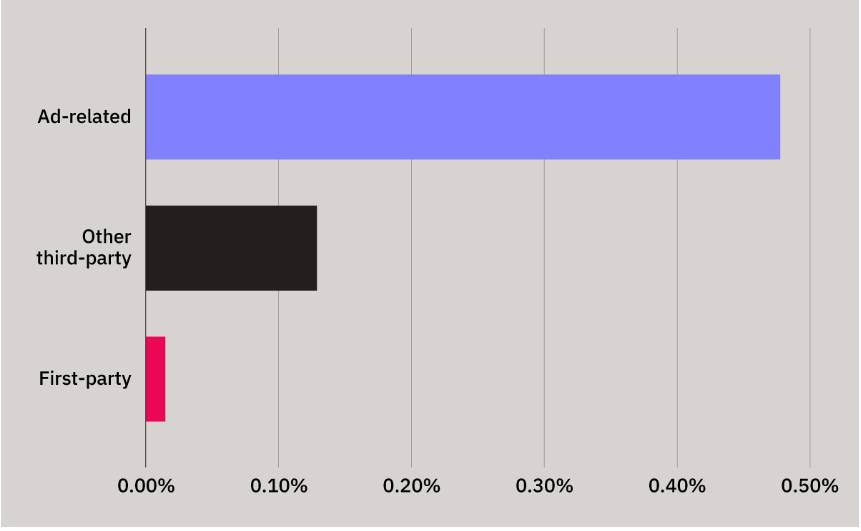
Ad-related and other third-party service SSL failure rates outpace those for first-party requests in a typical application.
Servers Overwhelmed by Request Volume
Often when backend issues happen and you want to understand the effect on your users, you operate without a full set of information. This is because the overloaded servers are also the ones that are supposed to collect the diagnostic information.
Not All Requests Are for Your Backend Servers
With backend observability tools, you have some level of visibility into network requests sent to your servers, but you have no visibility into requests sent to third-party services. Many important parts of mobile applications require access to network services that you do not directly control, such as:
- Payment providers.
- Ad providers.
- Map services.
- Content delivery networks (CDNs).
- Infrastructure-as-a-Service (IaaS) providers.
- Single sign-on (SSO) providers.
You must monitor network behavior from the client side to get insight into how the SDKs that provide these services are performing. Error rates, both for connection errors and HTTP errors, are often higher for the domains these services use than for first-party domains. In some cases, the error rates are at or near 100% due to configuration errors that are not easy to detect during testing.
Without client-side monitoring, you will also lack visibility into the latency of requests and the bandwidth they consume. Even if you invest time and money into reducing network request latency, if a service vendor has not made the same investment, your application’s performance will most likely be degraded.
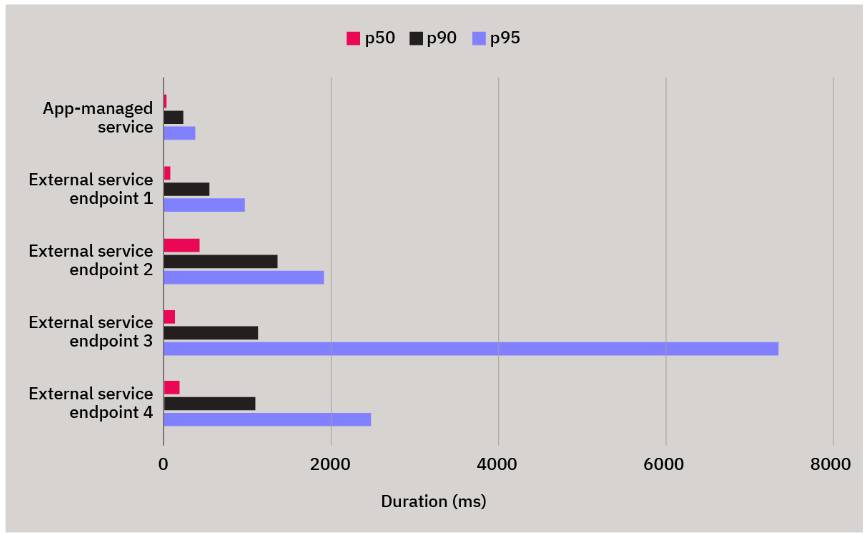
Example of an app where first-party endpoints are fast but external service endpoints are slower.
Not All Metrics Are Available From a Backend Perspective
Backend observability tools can measure only what they are exposed to. Examples of things that they cannot report on include:
DNS Lookup Time
DNS resolution happens against servers you do not control. It could be an ISP’s DNS servers or commonly used global DNS services like Cloudflare or Google. Regardless, you can’t collect data about the DNS resolution delay except from within your mobile application.
Connection Establishment and Response Transmission
Typically, a web server records the response time as the time elapsed between when the first bytes are read from the socket and the last bytes are written to the socket. This does not include things such as:
- Time spent in TCP or TLS handshakes.
- The time before the web server thread is able to read the first bytes of the request.
- Delays in the operating system put the response data out onto the network.
Network conditions between the server and the mobile app will impact the overall time taken to achieve the handshakes and send the response. If you have a poor connection with limited bandwidth, the server’s recorded response time can be overly optimistic. The web server will write its response to the socket, and the kernel will buffer that data. Thus, the web server can declare it is done with a response before the response has fully left the machine.
The time difference between the web server completing transmission of the response to the socket and it being sent over the network is usually fairly small. But with poor mobile network connections, this difference can significantly increase the overall time for a request. Measuring what users experience as the true response time is only possible from the client’s perspective.
Request Queue Time
The time when your code initiates a network request does not necessarily equate to the time the underlying libraries and operating system (OS) initiate the request to the remote server. For example, on iOS, the commonly used NSURLSession class controls the number of concurrent requests made to a host with the setting httpMaximumConnectionsPerHost; by default, this limits an app using an NSURLSession instance to six concurrent requests. Thus, if you make 10 requests to a single host, the last four will not start until some of the first six have completed. From the perspective of the backend server being accessed, the request time will not include the time a request was queued on the client. Similarly, the commonly used OkHttp library on Android has setMaxRequestsPerHost to implement similar behavior, with the default being set to five.
The dominant delay in fully completing a network request may not be the response time on the server, and the end-user mobile app experience will be impacted by delays introduced by factors such as those listed above.
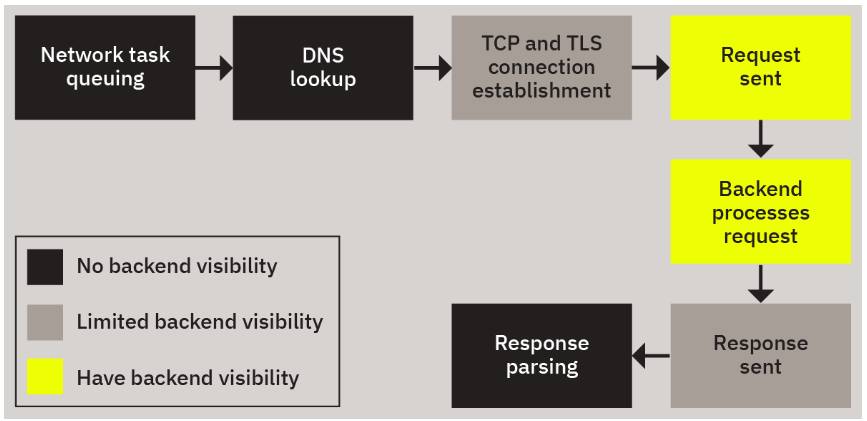
Backend visibility of the components of a mobile app network request.
Not All Request Responses Make It to Your Mobile Application
Your servers can process requests efficiently, but users can still be left with a broken experience.
Proxies can block or mutate responses from being received by mobile applications as the backend servers intended. Proxies are commonly used to restrict access to the internet when you connect to public WiFi. They also include security tools that restrict access based on the IP address you are accessing the service from.
We’ve had customers who saw requests that their servers sent with 200 (OK) HTTP status codes appear in their apps with 429 (too many requests) status codes, and HTML payloads where JSON was expected. In one such case, the IP being used to access the service was flagged by the security service that protected the backend API. Consequently, the security service intervened and replaced the response with an error message. However, the security service returned an HTML payload by default, as if the request came from a browser that could display this information to a user. The app was not capable of processing this since it expected a JSON response.
Not All Responses Can Be Handled by Your Mobile Application
If you have backend APIs that serve multiple client types — website, mobile web and mobile apps — it’s easy for payloads to be misconfigured for the limited resources that certain mobile devices have. For example, certain large payloads can cause deserialization failures on lower-end devices, with the app running out of memory and crashing. This can easily happen when you’re making a request to an endpoint that typically returns a response with a handful of objects, but for certain query parameters will return thousands of objects.
Another failure case is when the structure of the delivered data does not align with what the mobile app expects. Perhaps certain fields are missing or there are additional fields the app is not aware of, and this ends in a crash when the app tries to parse the response payload. More subtle variations of this type of failure are when unexpected values are delivered for a given field, for example a timestamp in milliseconds where seconds were expected, or values being null where they were expected to be populated. These may not lead to an immediate crash during parsing, but a crash can happen later when the model they have populated is eventually used.
From a backend perspective, all these network request responses would be considered successes, given that data was sent. However, what’s important is that data gets properly parsed on the client and the range of values match the expectations built into the app.

Example of a problematic JSON payload.
Not All Requests Are Isolated
While you can scale your backend services horizontally and deploy instances in a variety of geographical locations, your mobile application runs on a single device with a network connection you have no control over. This network pipe is shared by all applications on a device, and there’s little you can do to control the quality of this pipe.
In theory, you can control the number of concurrent requests your application code makes, but as application complexity increases, it becomes more difficult to reason about. In many cases, the network pipe does not have the capacity to support the combined bandwidth needed to support all concurrent requests.
This means the duration of your requests are not independent of each other. While it is theoretically possible to account for some aspects of this in backend monitoring, historically this has not been done. Requests that may have been impacted by other concurrent requests will simply look like outliers with no context to explain why they are outliers.
Not All Requests Your Mobile Application Makes Are Necessary
Similarly, as mobile application complexity increases, there’s been a shift towards more modular applications, which are commonly constructed as more than 10 independently developed modules. A big challenge in these cases is avoiding duplication of network requests.
Duplicate Network Requests
While it may make sense from a process perspective to develop components of an application independently, it makes coordination and testing between the different modules more challenging. Do you have a central module responsible for all network access? Or do you allow modules to make their own requests? If you have a centralized network access module, does it coordinate when multiple modules are requesting the same information at roughly the same time? If so, how do you determine if the data you have already requested is recent enough?
These are tough questions to answer, and even tougher scenarios to fully test if you get aggressive with caching data in the client. Frequently, teams choose the safer and simpler approach of just making requests independently in each module, and this may be the right decision in many cases. However, you should (at the very least) have visibility into how often your application repeatedly requests the same data in short time windows. We’ve found cases where applications make the same GET request to the same endpoint 10 times in a matter of seconds. This is probably not necessary and hurts the end-user experience, uses excessive bandwidth and increases the load on your backend servers.
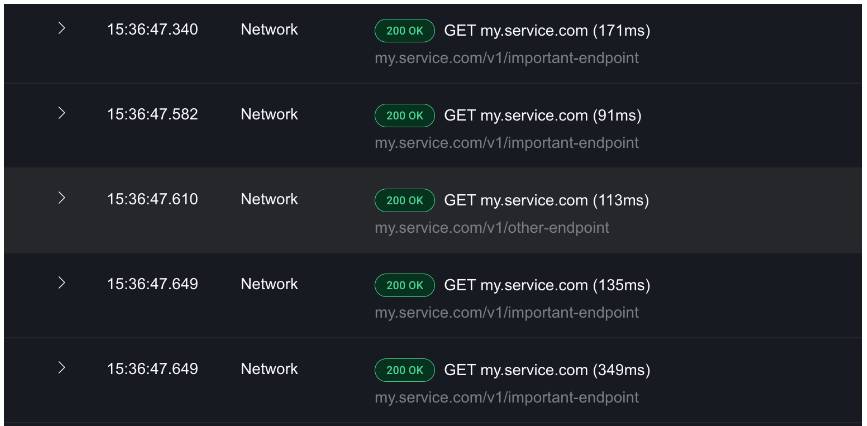
Four of the five calls to a host are GETs to the same endpoint in less than half a second.
Unused and Outdated Third-Party SDKs
It’s easy to accidentally leave no-longer-used, broken or misconfigured third-party SDKs in your mobile app. For example, your marketing team may try a new analytics SDK on a free trial, but when they decide to no longer proceed with it, no one tells the developers to remove it. This results in an endless stream of unnecessary and potentially failed network requests that bloat startup time and hurt app performance. These slowdowns might not cause crashes or throw errors, and your backend monitoring will be completely blind to them.
How To Get Visibility Into Client-Side Network Performance
You can unlock a lot of value by monitoring client-side network performance. Perhaps your application doesn’t have serious DNS lookup issues based on where the majority of your users are located, or maybe you don’t rely heavily on third-party network calls, but I’d be a bit surprised if at least one or two of these situations don’t apply to your application.
To learn what you have been missing out on, consider adding the Embrace SDK to your mobile application. In addition to sending data to our hosted service, you can try our SDK with an OTel exporter that allows you to gather mobile telemetry in your OTel-compatible observability tool of choice.
We’d love to hear about what you discover and any other networking issues you encounter! You can also join our Slack community to ask questions and learn more about improving your mobile observability.
YOUTUBE.COM/THENEWSTACK
Tech moves fast, don’t miss an episode. Subscribe to our YouTubechannel to stream all our podcasts, interviews, demos, and more.
