
包阅导读总结
1. 关键词:OpenTelemetry、Continuous Profiling、Elastic、eBPF、Observability
2. 总结:OpenTelemetry 纳入连续剖析作为核心遥测信号,Elastic 捐赠其代理。该代理具有低性能影响等关键特征,能解决传统剖析方法的局限。相关整合面临一些决策挑战,连续剖析有多种用途,行业趋势是更多厂商重视,专家也进行了相关讨论。
3. 主要内容:
– OpenTelemetry 动态
– 宣布纳入连续剖析为核心遥测信号
– 接收 Elastic 捐赠的基于 eBPF 的连续剖析代理
– 代理特点
– 低性能影响
– 无需代码插装等
– 支持多种语言和运行时
– 能观察第三方库和内核操作
– 面临的挑战
– 剖析数据模型整合决策
– 专用特殊兴趣小组的相关挑战
– 用途和优势
– 多种使用场景
– 解决传统剖析方法局限
– 行业趋势和讨论
– 更多厂商进入该领域
– 专家在视频中深入讨论相关整合
思维导图: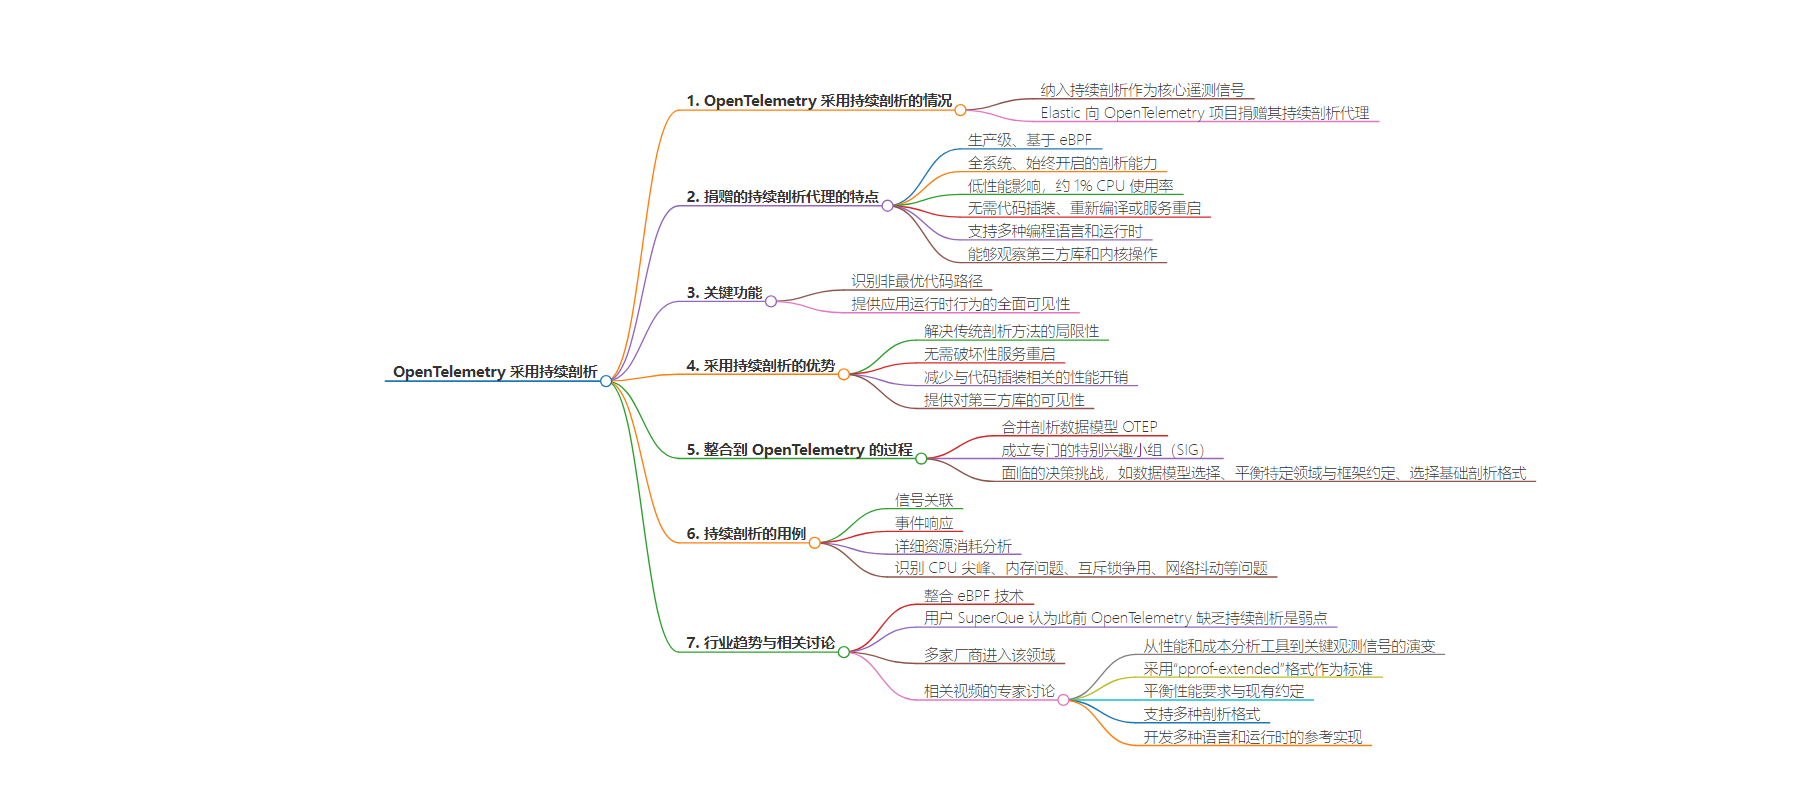
文章来源:infoq.com
作者:Matt Saunders
发布时间:2024/8/12 0:00
语言:英文
总字数:729字
预计阅读时间:3分钟
评分:85分
标签:OpenTelemetry,持续性能分析,Elastic,eBPF,可观察性
以下为原文内容
本内容来源于用户推荐转载,旨在分享知识与观点,如有侵权请联系删除 联系邮箱 media@ilingban.com
OpenTelemetry has announced that it has incorporated continuous profiling as a core telemetry signal, and Elastic has donated its continuous profiling agent to the OpenTelemetry project.
Elastic’s donation introduces a production-grade, eBPF-based continuous profiling agent to the OpenTelemetry ecosystem. This agent offers whole-system, always-on profiling capabilities with minimal overhead, addressing many limitations of traditional profiling approaches. This contribution follows the March 2023 merger of a profiling data model OTEP (OpenTelemetry Enhancement Proposal) and ongoing efforts to establish a stable specification and implementation for profiling within OpenTelemetry. Key features include:
- Low performance impact, with approximately 1% CPU usage
- No need for code instrumentation, recompilation, or service restarts
- Support for a wide range of programming languages and runtimes
- Ability to observe third-party libraries and kernel operations

The agent’s capabilities include identifying non-optimal code paths and providing comprehensive visibility into application runtime behaviour. This contribution should accelerate the adoption of profiling as the fourth key signal in OpenTelemetry, alongside tracing, metrics, and logs.
Adopting continuous profiling into an observability system addresses several limitations of traditional profiling methods. It eliminates the need for disruptive service restarts, reduces the performance overhead associated with code instrumentation, and provides visibility into third-party libraries that were previously challenging to profile.
The second announcement provides context on the broader journey of integrating profiling into OpenTelemetry. It details the formation of a dedicated Special Interest Group (SIG) for profiles and the challenges faced in developing a standardised approach to continuous profiling within the OpenTelemetry framework.
The SIG Profiles group had to navigate several essential decisions, including:
1. Whether to build upon existing data models or create an entirely new one
2. How to balance domain-specific profiling conventions with OpenTelemetry’s framework-specific conventions
3. Selecting an appropriate existing profiling format as a foundation
Integrating profiling data into the OpenTelemetry Collector follows a similar pattern to other signals. The data is ingested, deconstructed into the collector’s internal “pdata” format, and then processed uniformly alongside other telemetry signals.
Continuous profiling enables many use cases beyond traditional performance and cost analysis. These include signal correlation, incident response, and detailed resource consumption analysis. The technology shows promise in identifying issues like CPU spikes, memory problems, mutex contention, and network jitter. Adding continuous profiling to OpenTelemetry will help engineers identify resource-intensive code and increase vendor neutrality by reducing reliance on proprietary APM agents.
Another significant trend is integrating eBPF technology in profiling solutions like Elastic’s donated agent. eBPF allows for comprehensive system-wide profiling with minimal overhead, although it presents challenges in symbol management and runtime compatibility.
In a discussion about convincing organisations to adopt OpenTelemetry, user SuperQue on Reddit highlights the prior lack of continuous profiling in OpenTelemetry as being a weakness:
“Frankly, I haven’t seen the benefit of Otel. We’ve spent months and months working on deploying it, getting all the backend storage setup (clickhouse). But it hasn’t actually provided any additional value over the already instrumented with Prometheus libraries we use. I’m actually more looking forward to continuous profiling tools than Otel. The data that Polar Signals and Pyroscope produce look like they will tell you in much better detail on what parts of your code are slow. Much more useful than what tracing seems to provide.”
The OpenTelemetry community’s adoption of continuous profiling aligns with a growing industry trend. Several startups and major observability vendors have entered this domain recently, recognising the value of profiling data when correlated with other telemetry signals. Other continuous profiling agents, such as Polar Signals’ Parca Agent and Grafana Alloy and Grafana Agent are available in this space.
A video published on the OpenObservability Talks YouTube channel features an in-depth discussion on the integration of continuous profiling into OpenTelemetry, featuring experts Felix Geisendörfer from Datadog and Ryan Perry from Grafana Labs. They discuss the evolution of profiling from a performance and cost analysis tool to a key observability signal, alongside logs, metrics, and traces, and cover the merging of the OpenTelemetry Enhancement Proposal (OTEP) for profiling, which moves the profiling signal to an experimental stage within OpenTelemetry. They explain the decision to adopt an extended version of the pprof format, dubbed “pprof-extended,” as the standard for OTel profiling data. They go on to highlight the challenges in balancing performance requirements with OTel’s existing conventions and discuss the potential for supporting multiple profiling formats. They also touch on the development of reference implementations for various programming languages and runtimes.