包阅导读总结
1. 关键词:C++、内存问题、排查攻略、工具、案例
2. 总结:
本文介绍了 C++内存问题排查攻略,包括栈溢出、栈缓冲区溢出、内存泄漏等问题的排查方法及工具,还通过两个具体案例展示工具的组合使用,强调掌握常用排查方法对维护历史系统的重要性。
3. 主要内容:
– 栈溢出
– 定位方法:查看 coredump 文件为主,动态检测为辅
– 静态分析
– 原理:GCC 提供 -fstack-usage 选项输出每个函数栈最大使用量
– 工具:开源的 checkStackUsage,收费的 stackanalyzer
– 动态检测
– 通过 proc 文件系统 pmap 或查看 /proc/pid/maps 中的 stack
– 捕捉操作系统信号,使用 libsigsegv-devel 定义处理函数
– 查看 coredump 文件
– 栈缓冲区溢出
– 工具:GCC -fstack-protector、C11 Annex K、AddressSanitizer
– 内存泄漏
– 工具比较:eBPF 优点是非侵入,Valgrind memcheck 和 AddressSanitizer 等
– eBPF bcc-tools memleak 检测原理:通过内核或应用特定钩子点运行
– 举例及改进:支持火焰图更直观
– 其他内存问题
– AddressSanitizer 为主,Valgrind memcheck 为辅
– 多线程/协程的数据竞争
– ThreadSanitizer 基本不可用
– Valgrind 的 helgrind 和 drd 消耗内存大基本不可用
– AddressSanitizer 能检测内存异常
– 案例
– 低成本解决历史代码崩溃问题
– 解决偶发崩溃问题
思维导图: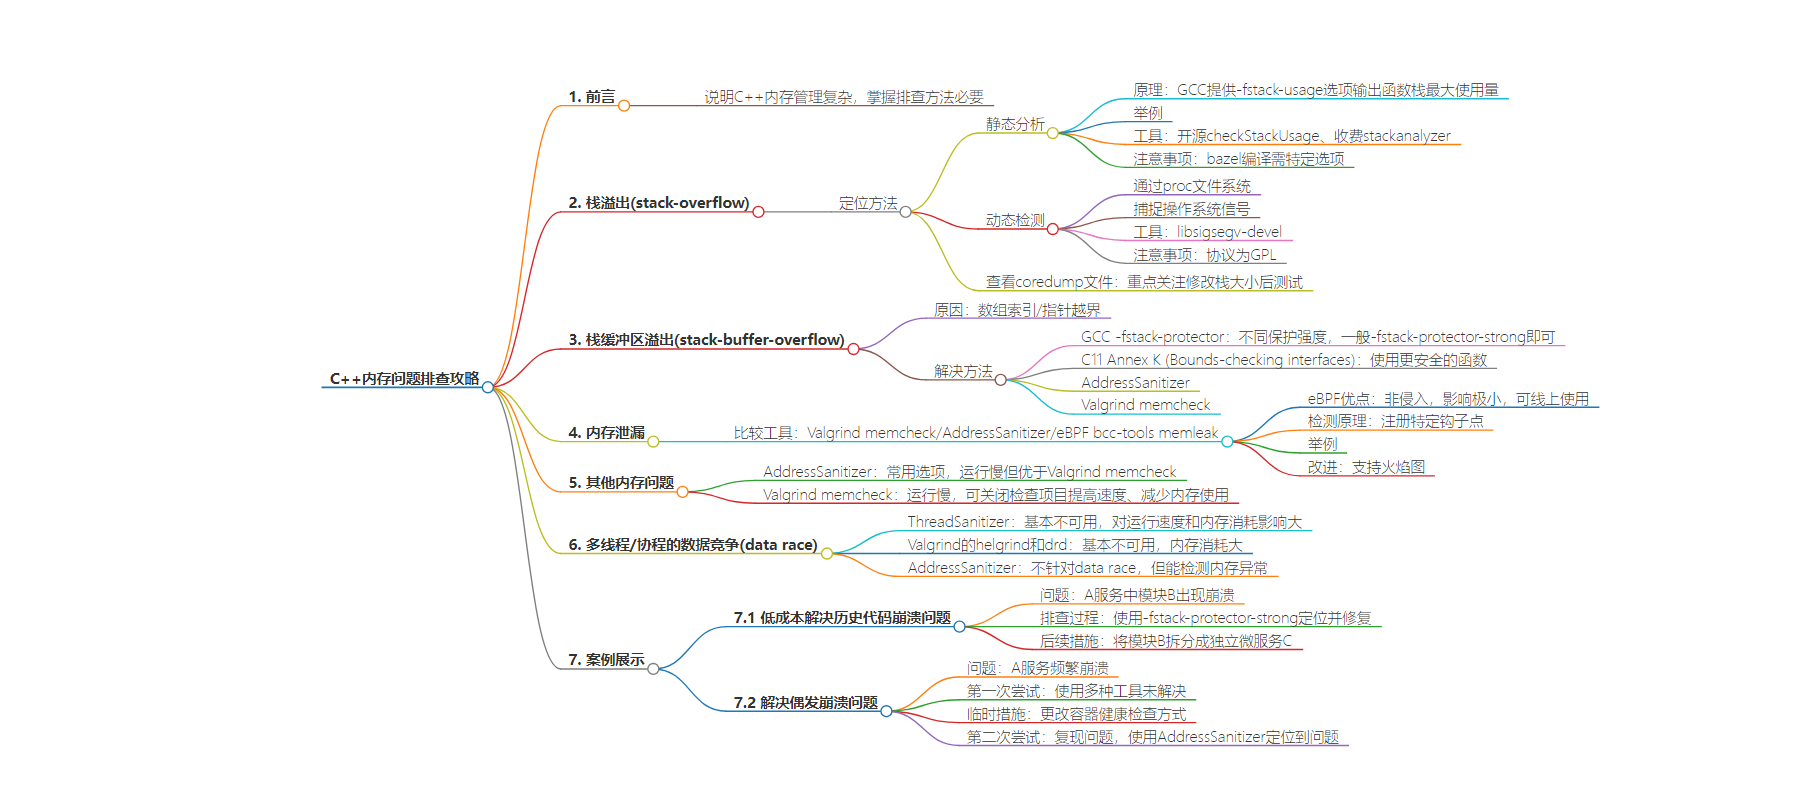
文章地址:https://mp.weixin.qq.com/s/7d2LhS-jyGJwEVNbdoBH-g
文章来源:mp.weixin.qq.com
作者:腾讯程序员
发布时间:2024/8/13 7:29
语言:中文
总字数:4739字
预计阅读时间:19分钟
评分:91分
标签:C++,内存管理,内存泄漏,栈溢出,AddressSanitizer
以下为原文内容
本内容来源于用户推荐转载,旨在分享知识与观点,如有侵权请联系删除 联系邮箱 media@ilingban.com

作者:johncchen
C++因其高性能仍然是许多关键应用的首选语言,但其复杂的内存管理也带来了诸多挑战。虽然使用现代C++能够有效解决大部分问题,但掌握常用的内存问题排查方法仍然十分必要,特别是在维护一些历史系统时。本文分为上下两篇:上篇(1~5)按照问题分类介绍和比较常用工具,下篇(6~7)通过两个具体案例展示这些工具的组合使用,希望能为读者带来有益的启发。笔者个人水平有限,文中难免存在疏漏之处,欢迎大家批评指正。
1. 栈溢出(stack-overflow):查看coredump文件为主,动态检测为辅
栈溢出的定位方法主要有静态分析、动态检测、查看coredump文件三种。
1.1 静态分析
1.1.1 原理
GCC提供了-fstack-usage选项,能输出每个函数栈的最大使用量。开启后,为每个编译目标创建.su文件,每行包括函数名、字节数、修饰符(static/dynamic/bounded)中的一个或多个。修饰符的含义如下:
-
static: 堆栈使用量在编译时是已知的,不依赖于任何运行时条件。 -
dynamic: 堆栈使用量依赖于运行时条件,例如递归调用或基于输入数据的条件分支。 -
bounded: 堆栈使用量虽然依赖于运行时条件,但有一个可预知的上限。
1.1.2 举个栗子
voidstatic_stack_usage(){intstatic_array[5];}
voiddynamic_stack_usage(intn){intval[n];}
intmain(){
static_stack_usage();
intn=10;
dynamic_stack_usage(n);
return0;
}

g++./stack_test.cc-ostack_test-fstack-usage

./stack_test.cc:2:6:voidstatic_stack_usage()16static
./stack_test.cc:4:6:voiddynamic_stack_usage(int)48dynamic
./stack_test.cc:6:5:intmain()32static
疑问:看到这里,估计有小伙伴会问了:既然dynamic是不确定的,静态分析还有意义吗?其实,实际代码的.su一般是下面这种,dynamic和bounded组合在一起,虽然动态但有上限,因此可以计算出“最大”的栈用量。
xxbuild.cpp:277:5:intXXBuild::BuildPage()528dynamic,bounded
每个函数的栈使用量有了,如果知道函数的调用链就可以得出栈的最大使用量了。调用链可以从二进制文件中反汇编得到。
1.1.3 工具
静态分析常用于资源有限的嵌入式系统,常常集成在它们的开发工具中。但非嵌入式系统的这类工具比较少。开源的有 checkStackUsage等,收费的有stackanalyzer等。
注意事项:
若使用bazel编译,默认的沙箱模式会删除.su文件,因此编译时需要增加–spawn_strategy=standalone选项(非沙箱模式)
1.2 动态检测
1.2.1 通过proc文件系统
pmap或查看/proc/pid/maps中的stack,缺点是进程退出后就看不到了。
1.2.2 捕捉操作系统信号
原理:
-
在 Unix-like 系统中,当程序执行非法内存访问时,操作系统会向该程序发送 SIGSEGV信号(段错误)。默认情况下,接收到此信号的程序会终止。 -
如果通过注册一个自定义的信号处理函数来拦截 SIGSEGV信号,处理函数会收到一个siginfo_t结构体,其中包含错误的地址和寄存器状态等上下文信息,可以判断是否发生了栈溢出。
工具:
libsigsegv-devel,可以定义自己的处理函数来响应内存访问错误,例如尝试恢复、记录错误信息或者优雅地关闭程序。
注意事项:
libsigsegv是GPL协议
1.3 查看coredump文件
重点关注:
修改栈(以及线程堆栈、协程堆栈)大小后测试。
2. 栈缓冲区溢出(stack-buffer-overflow):GCC -fstack-protector/C11 Annex K/AddressSanitizer
栈缓冲区溢出原因中很大一部分是数组索引/指针越界。在我看来,在项目中停止使用C风格的指针、使用STL容器能解决大部分问题。当然,一些项目处于维护状态,大规模改造未必合算,可以考虑使用以下工具。
2.1 GCC -fstack-protector
-fstack-protector的原理:
-
函数调用时,编译器在栈上分配一个随机生成的 canary 值(guard值),通常被放置在局部变量和控制数据(如返回地址)之间。 -
函数执行过程中,所有的局部变量操作都应当保持 canary 值不变。如果有缓冲区溢出,超出局部变量的数据可能会覆盖到 canary 值。 -
如果 canary 值被修改,程序会认为发生了栈溢出攻击,通常会立即终止,例如通过调用 __stack_chk_fail()函数。
有不同的保护强度-fstack-protector/-fstack-protector-all/-fstack-protector-strong/-fstack-protector-explicit,一般-fstack-protector-strong即可。
2.2 C11 Annex K (Bounds-checking interfaces)
使用 C11 标准中引入的strncpy_s()等函数,比 strcpy()/strncpy() 等函数更安全。它要求指定源和目标的大小,并在复制过程中检查这些大小,以防止溢出。如果发生错误(如无效参数或目标太小),strncpy_s() 将设置 errno 并可以选择使程序失败。
较低版本的gcc不支持c11, 可以使用一些第三方实现,比如的openharmony的third_party_bounds_checking_function
2.3 AddressSanitizer
详见4.1
2.4 Valgrind memcheck
详见4.2
3. 内存泄漏:eBPF+火焰图,高效直观
3.1 Valgrind memcheck/AddressSanitizer/eBPF bcc-tools memleak比较
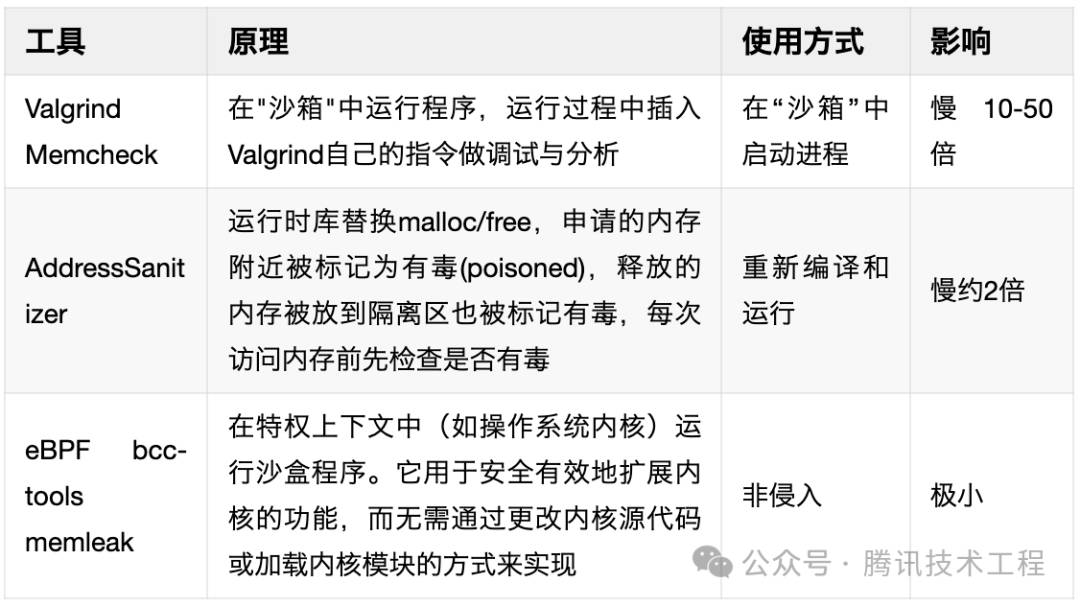
eBPF的最大的优点是“非侵入”,不需要重新编译或重启业务进程,对运行速度和内存用量的影响极小,可以忽略不计,可以线上使用。
3.2 eBPF bcc-tools memleak检测原理
eBPF程序是事件驱动的,在内核或应用经过特定钩子点(hook point)时运行。在memleak的源码中可以看到注册到了以下钩子点
attach_probes("malloc")
attach_probes("calloc")
attach_probes("realloc")
attach_probes("mmap",can_fail=True)#failedonjemalloc
attach_probes("posix_memalign")
attach_probes("valloc",can_fail=True)#failedonAndroid,isdeprecatedinlibc.sofrombionicdirectory
attach_probes("memalign")
attach_probes("pvalloc",can_fail=True)#failedonAndroid,isdeprecatedinlibc.sofrombionicdirectory
attach_probes("aligned_alloc",can_fail=True)#addedinC11
attach_probes("free",need_uretprobe=False)
attach_probes("munmap",can_fail=True,need_uretprobe=False)#failedonjemalloc
3.3 举个栗子
先写一段内存泄漏(不断增长)的测试代码
#include<iostream>
#include<chrono>
#include<thread>
#include<vector>
#include<string>

voidLeakOnce(std::vector<std::string>&strs){
//Generatearandomstring
std::stringstr;
conststd::stringcharacters="abcdefghijklmnopqrstuvwxyzABCDEFGHIJKLMNOPQRSTUVWXYZ0123456789";
for(inti=0;i<10;i++){
charrandomChar=characters[rand()%characters.length()];
str+=randomChar;
}
strs.emplace_back(std::move(str));
}

voidCallLeak(){
std::vector<std::string>strs;
while(true){
LeakOnce(strs);
std::this_thread::sleep_for(std::chrono::milliseconds(100));
}
}

intmain(){
CallLeak();
return0;
}

g++./leak_test.cc-oleak_test--std=c++11-g
检测结果如图,符合预期~
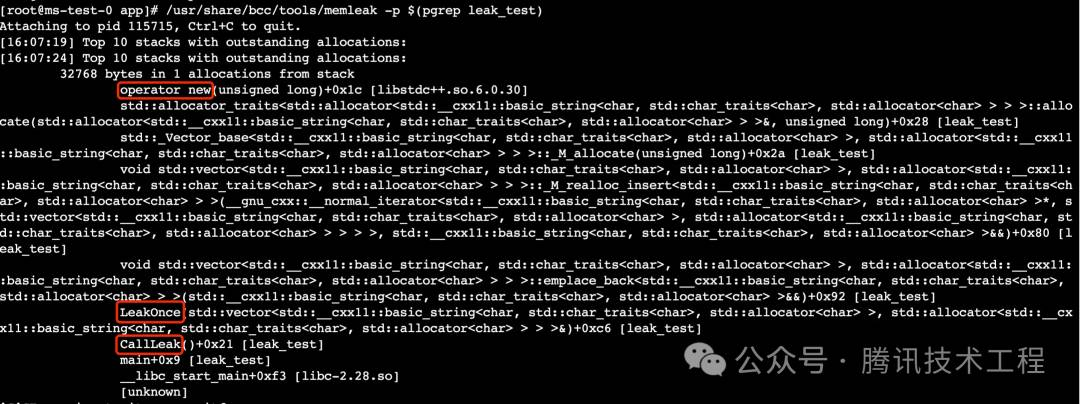
memleak具体选项详见-h,也可以参考官方例子。需要注意的是-O选项, attach to allocator functions in the specified object. 如果没有使用glibc而是使用jemlloc或tcmalloc,需要使用-O指定二进制文件(静态链接)或动态库(动态链接)。
3.4 改进memleak,支持火焰图
实际的内存泄漏经常是小规模、长时间的,会混杂在大量正常的内存申请和释放动作中,这时候memleak文本形式的输出就不够直观了。想到cpu性能调优经常用到的火焰图,如果memleak能生成直观的火焰图就好了。
火焰图的格式并不复杂,格式如下
[堆栈][采样值]
main;foo;bar76
PR4766有一个绘制火焰图的简单实现,没有合入主干很可惜。可以参考它,来修改已安装的bcc/tools/memleak。修改后执行:
/usr/share/bcc/tools/memleak2.py-p$(pgrepleak_test)--report--report-fileleak_test.stacks
flamegraph.pl--color=mem--countname="bytes"<leak_test.stacks>leak_test.svg
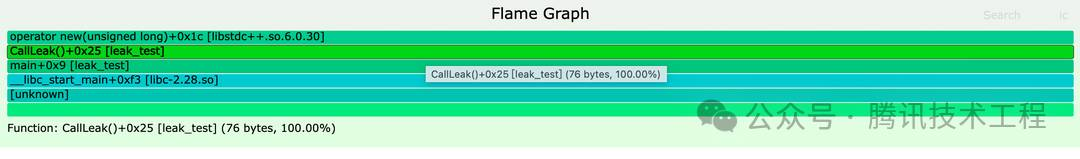
在中大型项目中,火焰图能够很好地区分框架与业务模块的内存操作,便于逐级排查,非常清晰。
4. 其他内存问题:AddressSanitizer为主,Valgrind memcheck为辅
4.1 AddressSanitizer
编译和链接时加上-fsanitize=address,完整选项见AddressSanitizerFlags,一些常用选项如下:
-
export ASAN_OPTIONS=”log_path=/my_path/asan:abort_on_error=1:disable_coredump=0:unmap_shadow_on_exit=1:debug=true:check_initialization_order=true:print_stats=true:strict_string_checks=true:dump_instruction_bytes=true”
AddressSanitizer会使程序运行慢约2倍,比Valgrind memcheck好太多,可以考虑使用线上节点排查问题。
4.2 Valgrind memcheck
运行速度慢10~50倍,消耗大量内存,可以通过关闭检查项目来提高速度、减少内存使用。
5. 多线程/协程的数据竞争(data race):ThreadSanitizer/Valgrind的helgrind和drd基本不可用,AddressSanitizer仍然可用
5.1 ThreadSanitizer
编译和链接增加-fsanitize=thread,编译通常遇到std::atomic_thread_fence报错,官方解释如下,好吧,std::atomic_thread_fence很常见,ThreadSanitizer基本不可用了。
-Wno-tsanDisable warnings about unsupported features in ThreadSanitizer.ThreadSanitizer does not support
std::atomic_thread_fenceand can report false positives.
除此之外,开启ThreadSanitizer对运行速度和内存消耗也有较大影响:
The cost of race detection varies by program, but for a typical program, memory usage may increase by 5-10x and execution time by 2-20x.
5.2 Valgrind helgrind/drd
比起ThreadSanitizer,需要消耗更多内存。我做了个测试,一个使用内存2.5G的服务,使用Valgrind helgrind或drd启动,32G内存都不够、直接OOM,因此在规模大些的项目中基本不可用。
5.3 AddressSanitizer仍然可用
AddressSanitizer不针对data race,但能检测内存异常。
下篇以排查某A服务内存问题的过程为例,演示上篇中工具的使用。其实,上篇的工具是下篇踩坑、填坑的经验总结。
6. 低成本解决历史代码崩溃问题
A 服务中有一大块老旧的业务逻辑,称之为模块 B,其特点如下:
-
大量 C 风格字符串操作(如 strcpy 等),存在越界风险
问题出现:服务以前运行平稳,但从某天开始,线上节点隔三差五就会出现崩溃。查看 coredump 文件,发现崩溃在模块B的代码中, frame 0 中某些局部变量损坏。然而,重放崩溃前后一段时间内的请求并不能复现崩溃,应该是其他请求的栈缓冲区溢出,破坏了这条请求的栈。此类问题很难直接根据 coredump 文件定位。
排查过程:如 2.1 中所述,使用 -fstack-protector-strong 重新编译并上线,结果断断续续地因为 __stack_chk_fail 出现崩溃,这就好办了。按图索骥,发现是某些请求触发了历史 bug,导致一些局部变量指针越界,针对性地添加边界判断就修复了,从而以较小的代价解决了复杂历史代码的崩溃问题。
后续措施:考虑到模块 B 可能还有其他坑,一旦出现问题将导致 A 服务的节点崩溃,影响整体 SLA。因此将模块 B 拆分成独立的微服务 C。如果服务 A 调用服务 C 失败,可以走降级链路,从而提高业务整体的可用性。
7. 解决偶发崩溃问题
问题出现:A 服务频繁上线,经常在一周内发布三四个版本。某段时间内,崩溃的概率显著增加。查看 coredump 文件,发现经常崩溃在 STL 容器(如 std::map、std::unordered_map、std::vector 等)中 std::allocator 的析构相关函数,但backstrace不确定,有时在这个模块中有时在那个模块中。重放崩溃前后一段时间内的请求无法复现崩溃,推测又是内存踩踏问题。
第一次尝试:逐一使用2.1 ~2.3的 GCC -fstack-protector /C11 Annex K/AddressSanitizer ,回放线上请求,结果都正常,这就尴尬了……
鉴于一时难以解决问题,首先采取措施确保线上稳定:
-
将容器的健康检查方式从 TCP 改为 HTTP,这样在 core dump 开始而不是结束后就能检测出节点异常(core 文件约 20G,core dump 过程持续几分钟),尽早从北极星(服务注册与发现平台)上摘除,减少对线上的影响。这样线上可以继续开启coredump,方便排查问题。
第二次尝试:
-
通过监控逐渐发现一些规律:崩溃集中在进程启动阶段,日常运行时很少。因此怀疑与进程启动时的状态或特定请求有关。 -
下一步是复现问题。在崩溃概率最高的地域,新建一个旁路 workload(两个节点),将北极星权重调为其他节点的 1/N,使用 API 定期重启旁路 workload 的 pod。经过几天,问题复现了! -
backstrace与之前类似,找不出线索。那就上工具吧,能在线上使用的检测工具也就只有 AddressSanitizer了,编译一版部署到旁路 workload,继续定期重启,等待结果…… -
果然,断断续续出现了一些崩溃,但查看 coredump 文件的backstrace仍难以找到有效线索。有时崩溃在插件中,有时在 encode 过程中。咨询相关插件的同学,他们也感到很奇怪,没有思路。直到,直到,下面这个错误出现:
==181==ERROR:AddressSanitizer:attemptingdouble-freeon0x61b000258480inthreadT14(FiberWorker_02):
#00x7f3a1f52a878inoperatordelete(void*,unsignedlong)../../../../libsanitizer/asan/asan_new_delete.cpp:164
#10x13d4f0cinstd::__new_allocator<char>::deallocate(char*,unsignedlong)/usr/lib64/gcc/x86_64-pc-linux-gnu/12.3.0/../../../../include/c++/12.3.0/bits/new_allocator.h:158
#20x13d4f0cinstd::allocator<char>::deallocate(char*,unsignedlong)/usr/lib64/gcc/x86_64-pc-linux-gnu/12.3.0/../../../../include/c++/12.3.0/bits/allocator.h:200
#30x13d4f0cinstd::allocator_traits<std::allocator<char>>::deallocate(std::allocator<char>&,char*,unsignedlong)/usr/lib64/gcc/x86_64-pc-linux-gnu/12.3.0/../../../../include/c++/12.3.0/bits/alloc_traits.h:496
#40x13d4f0cinstd::__cxx11::basic_string<char,std::char_traits<char>,std::allocator<char>>::_M_destroy(unsignedlong)/usr/lib64/gcc/x86_64-pc-linux-gnu/12.3.0/../../../../include/c++/12.3.0/bits/basic_string.h:300
#50x13d4f0cinstd::__cxx11::basic_string<char,std::char_traits<char>,std::allocator<char>>::_M_dispose()/usr/lib64/gcc/x86_64-pc-linux-gnu/12.3.0/../../../../include/c++/12.3.0/bits/basic_string.h:294
#60x13d4f0cinstd::__cxx11::basic_string<char,std::char_traits<char>,std::allocator<char>>::_M_mutate(unsignedlong,unsignedlong,charconst*,unsignedlong)/usr/lib64/gcc/x86_64-pc-linux-gnu/12.3.0/../../../../include/c++/12.3.0/bits/basic_string.tcc:338
#70x1b91ac5instd::__cxx11::basic_string<char,std::char_traits<char>,std::allocator<char>>::_M_append(charconst*,unsignedlong)/usr/lib64/gcc/x86_64-pc-linux-gnu/12.3.0/../../../../include/c++/12.3.0/bits/basic_string.tcc:420
#80x1b91ac5instd::__cxx11::basic_string<char,std::char_traits<char>,std::allocator<char>>::append(charconst*,unsignedlong)/usr/lib64/gcc/x86_64-pc-linux-gnu/12.3.0/../../../../include/c++/12.3.0/bits/basic_string.h:1430
#90x1b91ac5instd::__cxx11::basic_string<char,std::char_traits<char>,std::allocator<char>>::append(std::__cxx11::basic_string<char,std::char_traits<char>,std::allocator<char>>const&)/usr/lib64/gcc/x86_64-pc-linux-gnu/12.3.0/../../../../include/c++/12.3.0/bits/basic_string.h:1396
#100x1b91ac5instd::__cxx11::basic_string<char,std::char_traits<char>,std::allocator<char>>::operator+=(std::__cxx11::basic_string<char,std::char_traits<char>,std::allocator<char>>const&)/usr/lib64/gcc/x86_64-pc-linux-gnu/12.3.0/../../../../include/c++/12.3.0/bits/basic_string.h:1338
#110x1b91ac5inconstruct_xx_query(thread_data*)xx/yy/zz/aa_util.cc:66
···
0x61b000258480islocated0bytesinsideof1539-byteregion[0x61b000258480,0x61b000258a83)
freedbythreadT13(FiberWorker_01)here:
#00x7f3a1f52a878inoperatordelete(void*,unsignedlong)../../../../libsanitizer/asan/asan_new_delete.cpp:164
#10x13d4f0cinstd::__new_allocator<char>::deallocate(char*,unsignedlong)/usr/lib64/gcc/x86_64-pc-linux-gnu/12.3.0/../../../../include/c++/12.3.0/bits/new_allocator.h:158
#20x13d4f0cinstd::allocator<char>::deallocate(char*,unsignedlong)/usr/lib64/gcc/x86_64-pc-linux-gnu/12.3.0/../../../../include/c++/12.3.0/bits/allocator.h:200
#30x13d4f0cinstd::allocator_traits<std::allocator<char>>::deallocate(std::allocator<char>&,char*,unsignedlong)/usr/lib64/gcc/x86_64-pc-linux-gnu/12.3.0/../../../../include/c++/12.3.0/bits/alloc_traits.h:496
#40x13d4f0cinstd::__cxx11::basic_string<char,std::char_traits<char>,std::allocator<char>>::_M_destroy(unsignedlong)/usr/lib64/gcc/x86_64-pc-linux-gnu/12.3.0/../../../../include/c++/12.3.0/bits/basic_string.h:300
#50x13d4f0cinstd::__cxx11::basic_string<char,std::char_traits<char>,std::allocator<char>>::_M_dispose()/usr/lib64/gcc/x86_64-pc-linux-gnu/12.3.0/../../../../include/c++/12.3.0/bits/basic_string.h:294
#60x13d4f0cinstd::__cxx11::basic_string<char,std::char_traits<char>,std::allocator<char>>::_M_mutate(unsignedlong,unsignedlong,charconst*,unsignedlong)/usr/lib64/gcc/x86_64-pc-linux-gnu/12.3.0/../../../../include/c++/12.3.0/bits/basic_string.tcc:338
#70x1b91ac5instd::__cxx11::basic_string<char,std::char_traits<char>,std::allocator<char>>::_M_append(charconst*,unsignedlong)/usr/lib64/gcc/x86_64-pc-linux-gnu/12.3.0/../../../../include/c++/12.3.0/bits/basic_string.tcc:420
#80x1b91ac5instd::__cxx11::basic_string<char,std::char_traits<char>,std::allocator<char>>::append(charconst*,unsignedlong)/usr/lib64/gcc/x86_64-pc-linux-gnu/12.3.0/../../../../include/c++/12.3.0/bits/basic_string.h:1430
#90x1b91ac5instd::__cxx11::basic_string<char,std::char_traits<char>,std::allocator<char>>::append(std::__cxx11::basic_string<char,std::char_traits<char>,std::allocator<char>>const&)/usr/lib64/gcc/x86_64-pc-linux-gnu/12.3.0/../../../../include/c++/12.3.0/bits/basic_string.h:1396
#100x1b91ac5instd::__cxx11::basic_string<char,std::char_traits<char>,std::allocator<char>>::operator+=(std::__cxx11::basic_string<char,std::char_traits<char>,std::allocator<char>>const&)/usr/lib64/gcc/x86_64-pc-linux-gnu/12.3.0/../../../../include/c++/12.3.0/bits/basic_string.h:1338
#110x1b91ac5inconstruct_xx_query(thread_data*)xx/yy/zz/aa_util.cc:66
···

construct_xx_query(thread_data*)xx/yy/zz/aa_util.cc:66的代码是
thread_data->string_bb+=judge_cc()
查看代码上下文,终于找到了原因!在某类请求中使用协程并发调用后端服务,而 thread_data->string_bb(std::string 类型)变量是唯一的,多个协程同时修改 thread_data->string_bb,导致 double-free!由于同时写入是小概率事件,所以崩溃是偶发的。原来是 data race 问题……
-
再查看提交历史,发现多协程并发调用是在某个版本上线的,当时一切正常;上百个版本之后,调用流程中增加了这行问题代码。冗长膨胀的流程函数中新增一行代码很难引起注意,多人开发非常容易踩坑。 -
彻底解决问题需要从设计入手:重构流程,遵循单一职责,将修改集中到一处,便于检查;传参变成只读引用,消除 data race。
总结:
大部分问题,尤其是难以排查的问题,应该在设计阶段就被解决掉,越往后代价越大。正所谓“善战者无赫赫之功”。
近期好文:
GPU 性能原理拆解
几款顶级的AI写作助手工具