
包阅导读总结
1. 关键词:Java 应用、内存使用、垃圾回收、测试、性能优化
2. 总结:
本文主要介绍如何确定 Java 应用的内存使用需求以实现最佳性能和最低运营成本,包括进行可重复的负载模拟测试,利用垃圾回收器的日志文件分析内存使用情况,还以 Spring PetClinic 应用为例展示了具体操作和结果。
3. 主要内容:
– 确定 Java 应用理想内存大小的重要性
– 成本和生态影响促使正确规划机器尺寸
– 理解内存需求对性能和成本的意义
– 测试应用的方法
– 具有类似实际使用的可重复负载模拟
– 相关测试指南
– 给应用足够的预热时间
– 注意本地测试的负载影响
– 进行真实环境测试
– 可在生产环境测试并获取 GC 日志
– 以 Spring PetClinic 为例的实验
– 应用配置和运行测试
– 使用 JMeter 进行测试
– 介绍 JMeter 及其使用方式
– 以无头模式运行负载测试并生成报告
– 阅读 JMeter 报告
– 检查 GC 日志结果
– 比较不同 OpenJDK 版本的 GC 日志差异
– 结论:垃圾回收器日志可用于确定内存需求,生产环境测试很关键
思维导图: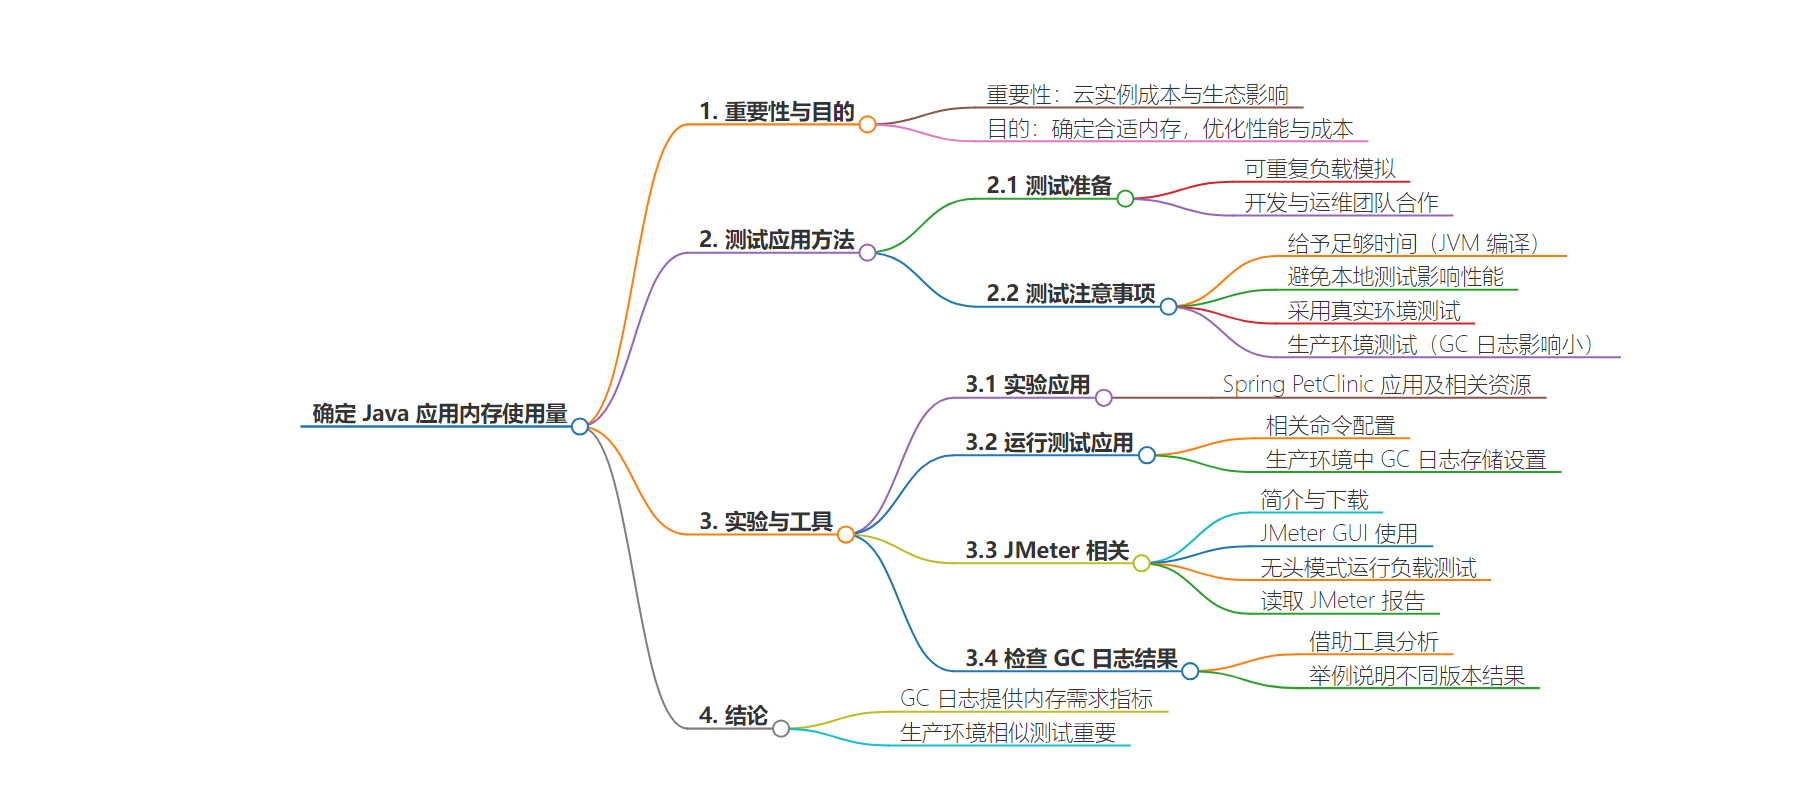
文章地址:https://thenewstack.io/how-to-test-how-much-memory-your-java-application-uses/
文章来源:thenewstack.io
作者:Frank Delporte
发布时间:2024/8/2 15:07
语言:英文
总字数:1610字
预计阅读时间:7分钟
评分:87分
标签:Java,内存管理,垃圾回收,性能测试,云优化
以下为原文内容
本内容来源于用户推荐转载,旨在分享知识与观点,如有侵权请联系删除 联系邮箱 media@ilingban.com
Determining the ideal memory size to run a Java application can be very difficult. But with the rising cost of cloud instances and their ecological impact, it’s important to dimension your machines correctly to be able to handle the expected load without overdimensioning so you can minimize the cost of the machine and, at the same time, reduce its ecological impact. Understanding an application’s memory size requirements is important to achieving maximum performance at the lowest operational cost.
I’ll show you how to use the garbage collector (GC) log files to determine the required memory size for an application. Thanks to the Java runtime, we can rely on the GC to clean up memory that is no longer used and keep the overall amount as low as possible. While doing this, the GC can output a log file with a lot of information that can help us find problems in the code and define the right dimensions for our servers or virtual environments.
How To Test Your Application
The hardest but most important part of a real-world test on your applications is having a repeatable load simulation that resembles the application’s actual use. This is an important step in developing and deploying an application and will require cooperation between your dev and DevOps teams.
There are a few important results you want to learn from such a test: defining the amount of memory an application needs and testing the maximum throughput. Here are a few guidelines to achieve this goal:
- Take your time: When a Java application is executed, the JVM recompiles the most-used bytecode (class files) to native code. This process takes some time (known as the warm-up time), so you need to wait until your application has been used long enough with the typical load you expect. This means all the code that gets executed has been called by the load put on the application.
- Be careful with local tests: Some tests can be easily executed on your own machine, but be aware of the load of the test itself. Executing a load test on the same machine that runs the application can cause CPU and/or memory overload that hurts the performance of the application under test.
- Use a real-world test: A test is valid only when you can simulate the expected load in an environment similar to your production system.
- Test in production: GC logs have minimal impact on your system’s performance. In many cases, this will be a far easier and cheaper solution to get real-life log results compared to setting up a full test environment.
Experimenting With Spring PetClinic
I used the Spring PetClinic application to gather test results for this article. The sources are available on GitHub and include a JMeter test script.
Running the Test Application
To follow this approach, get the source code, compile the application and start it using the following commands:
Your application is now configured to store the garbage collection logging in a single file. This setting is ideal for this test. But when enabling GC log in production, you should use rolling files to prevent the file from becoming too big and filling your storage space. For instance, use -Xlog:gc,safepoint:gc.log::filecount=10,filesize=100M to set the log rotation to a maximum of 10 files of 100MB each. When you don’t define file count and file size, the default is five files of 20MB each, so GC logging won’t use more than 100MB.
About JMeter
The Spring PetClinic project contains a JMeter test. Such a test can be executed with Apache JMeter, a 100% pure open source Java application designed to load test functional behavior and measure performance. It was initially designed for testing web applications but has since expanded to other test functions. Check the latest version (on jmeter.apache.org/download_jmeter.cgi) and download it.
JMeter tests can be executed with the GUI application, but this is not advised as it introduces the risk of the GUI affecting the test’s performance. The GUI should only be used to create a test or run it to validate its configuration.
Creating a Test With JMeter GUI
Start the Apache JMeter GUI application:
$ java -jar ~/Downloads/apache-jmeter-5.6.3/bin/ApacheJMeter.jar
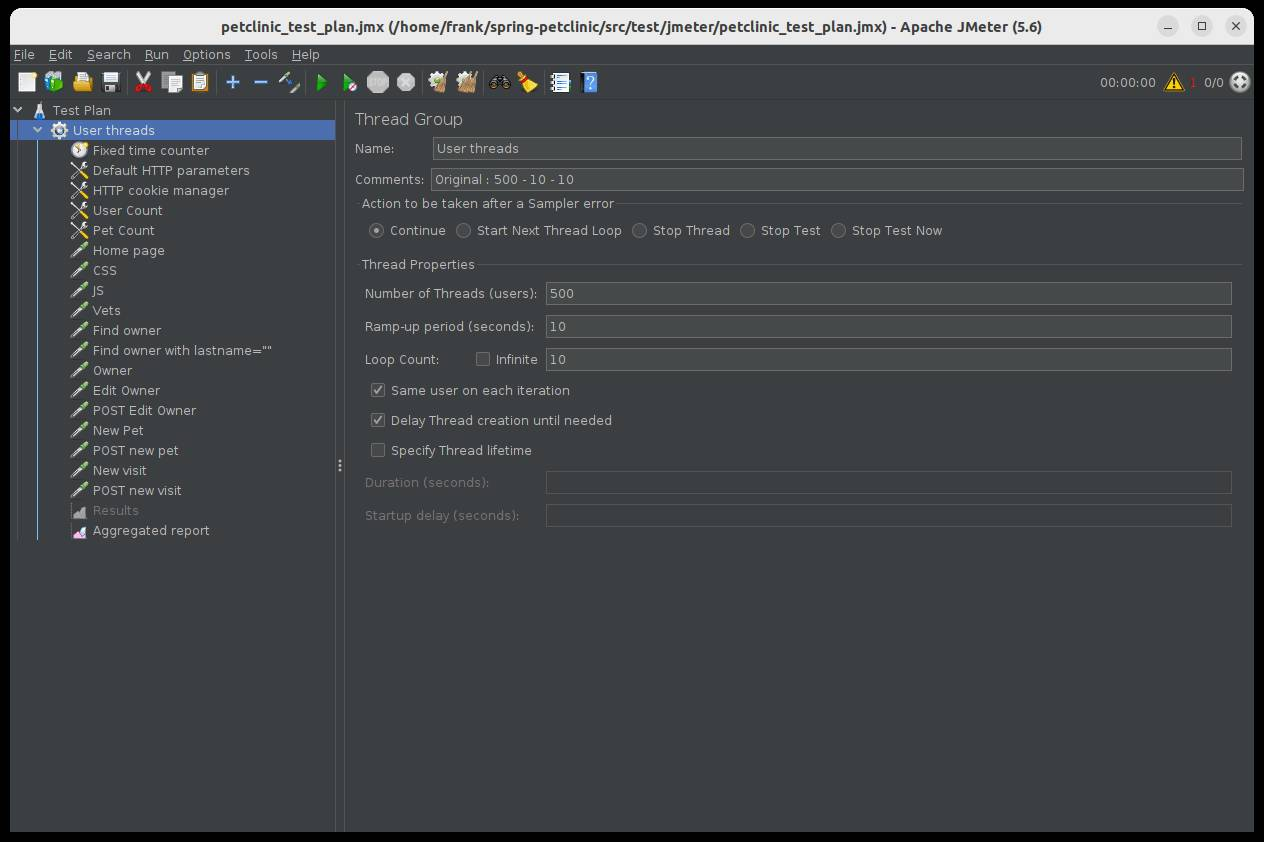
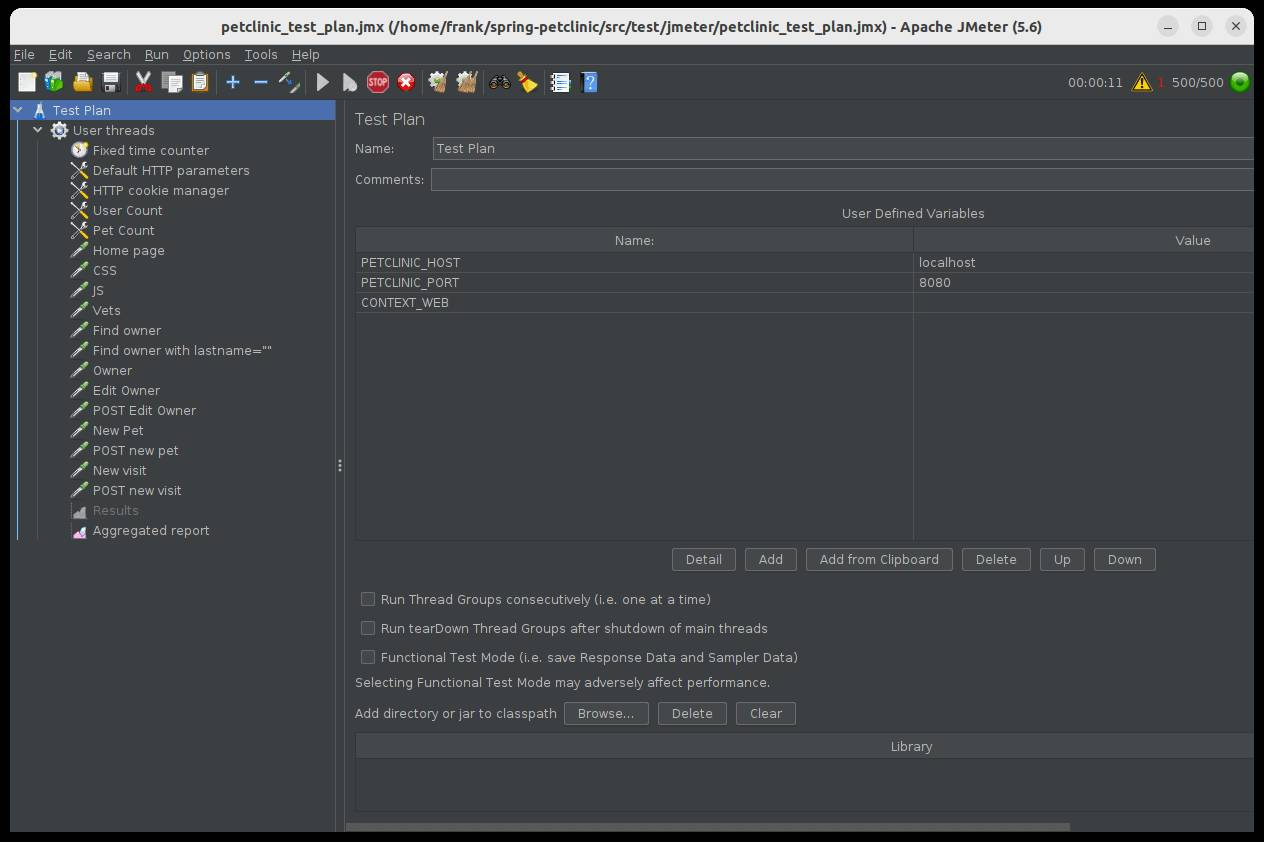
- In the UI, click File > Open, and select the file
spring-petclinic/src/test/jmeter/petclinic_test_plan.jmx. - You can execute the test to validate the configuration by hitting the Start button, which will start threads to simulate 500 users.
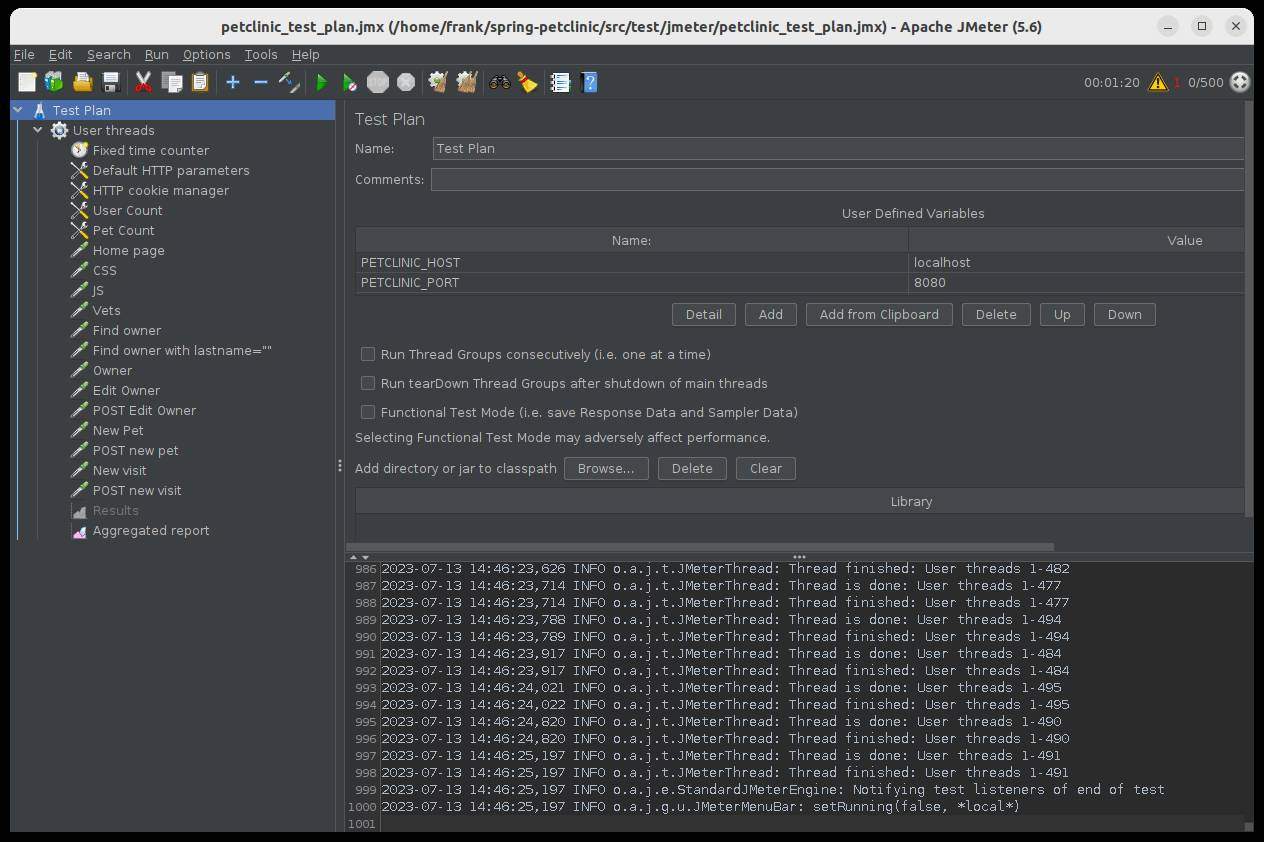
- Let it run until the test is finished. The number of active threads will drop from 500 to 0.
Running the Load Test With JMeter in Headless Mode
For the actual test, we will execute JMeter in headless mode. In my case, I execute the test on the same machine that is running the application because it has enough memory and CPU to handle both. You need to make sure this is valid for your test when using this same approach.
Let’s run a test and generate a report with the following options:
- -n: run in headless mode (no GUI)
- -t: the path to the
.jmxtest script to be executed - -l: the path to the
.jtlfile to store the raw results - -o: the path to the output folder to generate the report dashboard after the load test, which must be an empty directory
- -e: generate report dashboard after the load test
$ java -jar ApacheJMeter.jar -n -t spring-petclinic/src/test/jmeter/petclinic_test_plan.jmx -l jmeter.jtl -o jmeter-report/ -e
When you don’t add the -e option, you can still generate an HTML report later based on the .jtl file created during the test run.
- -g: the path to the
.jtlfile generated during the test - -o: the folder to store the HTML report
$ java -jar ApacheJMeter.jar -g jmeter.jtl -o jmeter-report/
As each new Java runtime version brings performance improvements, it’s important to know which version is used on your production system. I executed my tests with Azul Zulu Builds of OpenJDK, version 21.0.3.
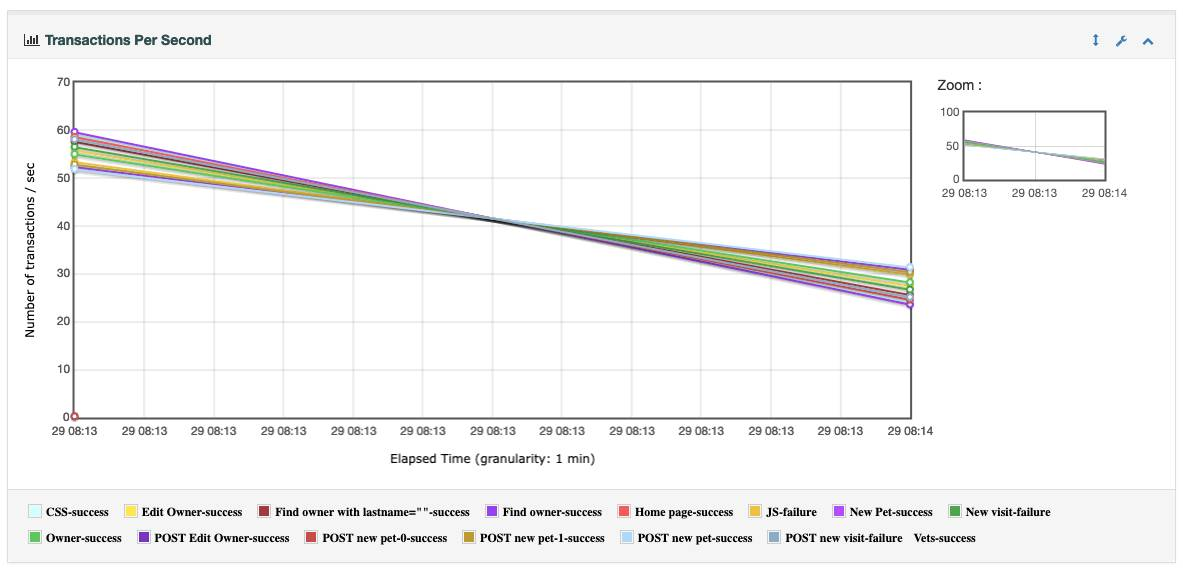
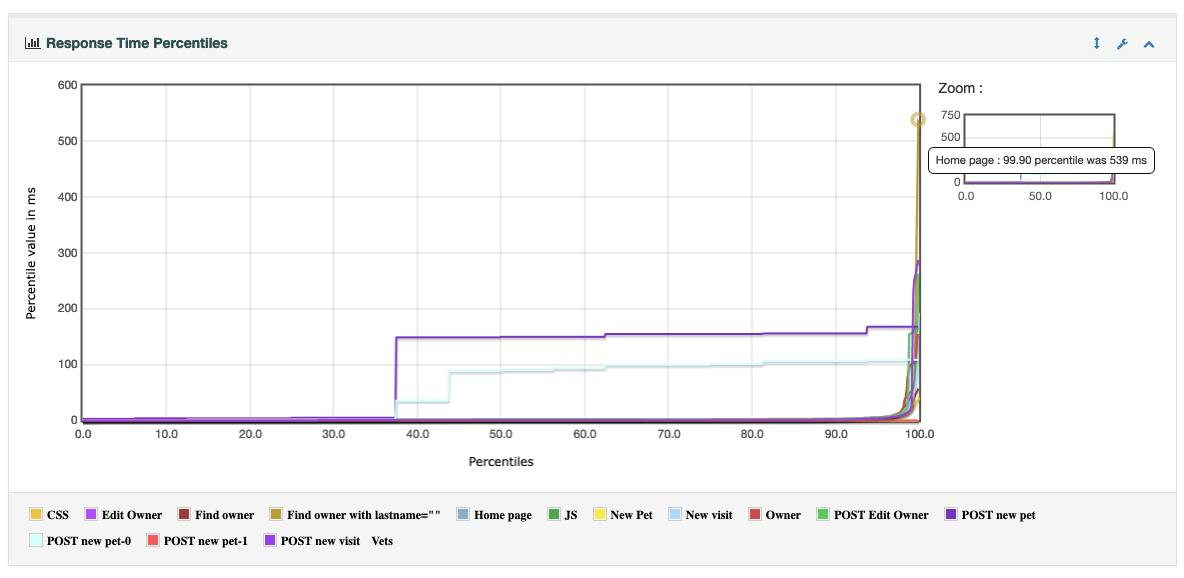
Reading the JMeter Report
Within the JMeter HTML report directory (jmeter-report/ in my case, as specified with the -o parameter), you can find a web page with the results of the JMeter test. You won’t find any memory-related information here, but the results of the tests defined in the JMeter test file. For example: response time percentiles, throughput in hits per second, etc..
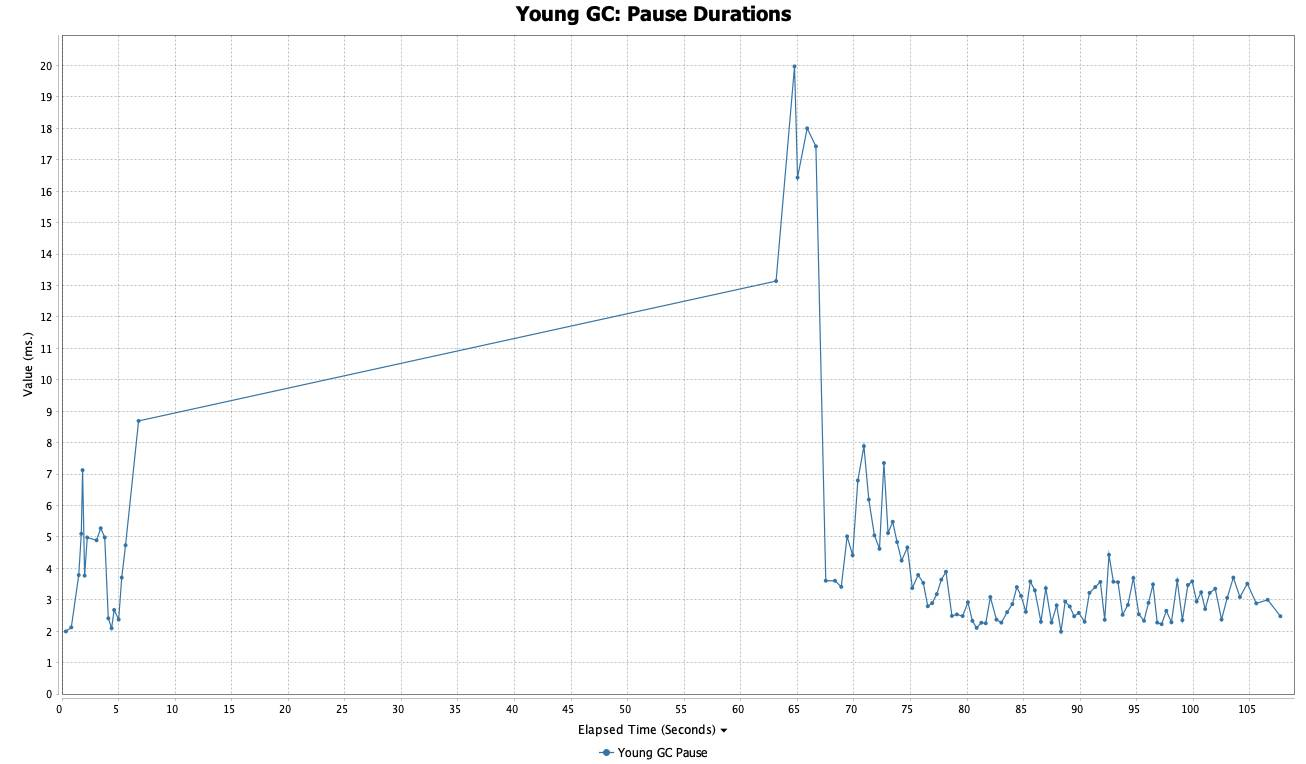
Inspecting the GC Log Results
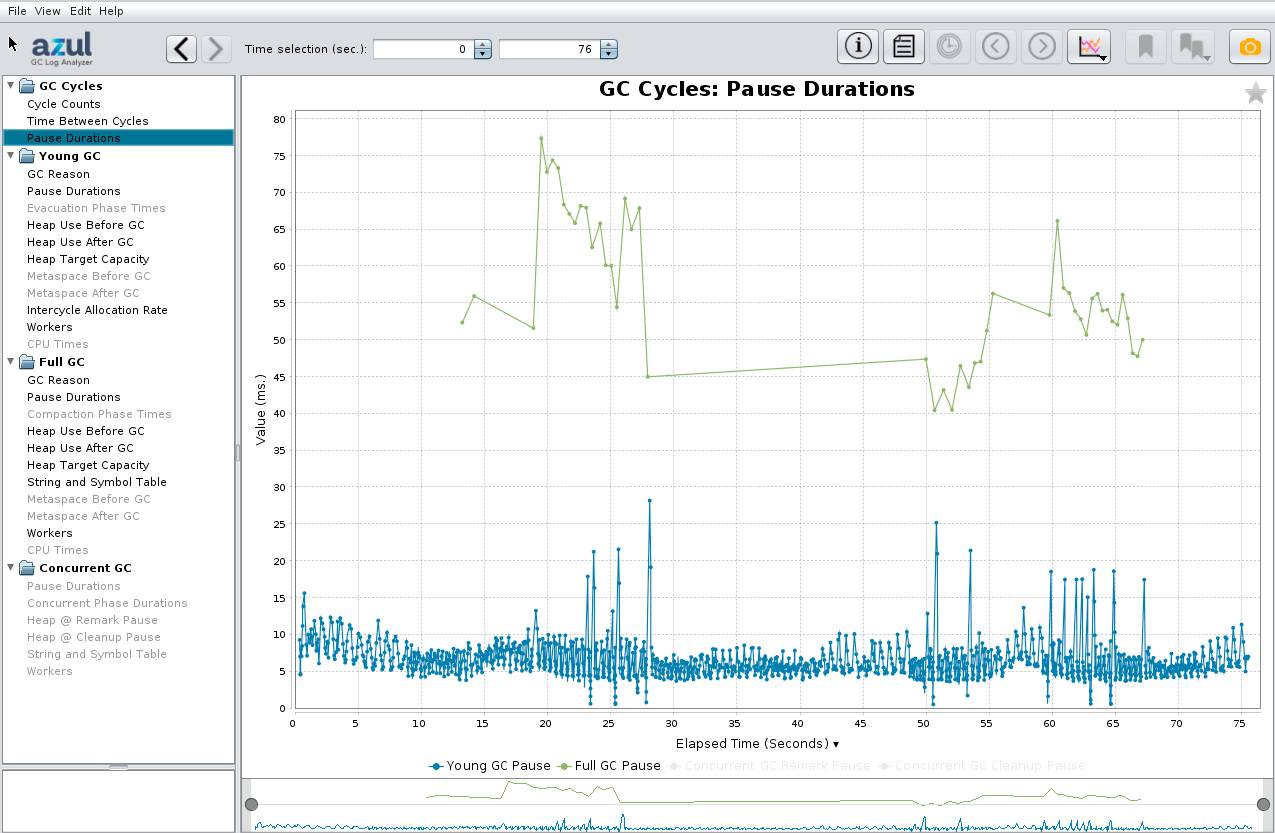
The gc.log file is the “place to be” to learn more about the memory usage of our application. With Azul GC Log Analyzer, we can read this file and visualize a set of graphs over time (wall clock and uptime) to inspect the garbage collector, the JIT (just in time) compiler, system metrics and more. The following charts show us that the garbage collector pause durations stay below 10ms after the initial load, and the heap size after garbage collection stays around 64MB. We advise you to use double that value to dimension your system. So in this case, the application would be able to handle the same load as generated during the test, with 128MB of memory.
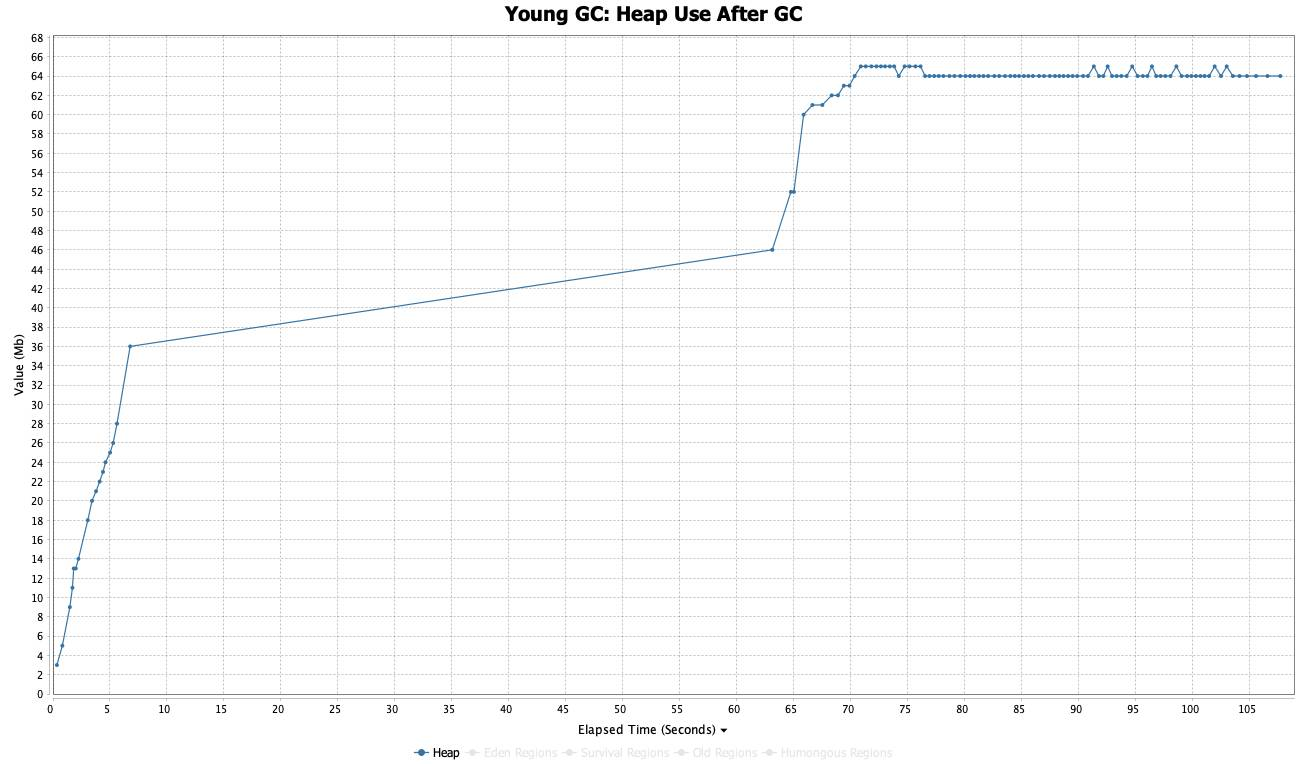
You can follow the same principle with your application and recheck the pause durations and heap usage after changing the –Xmx setting of your Java runtime, or the memory configuration of your virtual environment.
Differences in GC Logs Between Azul Zing and Zulu Builds of OpenJDK
With a different internal-only benchmark, we created some extra log files to demonstrate the different results provided by version 17 of Azul Zulu and Zing Builds of OpenJDK.
Results With Zulu
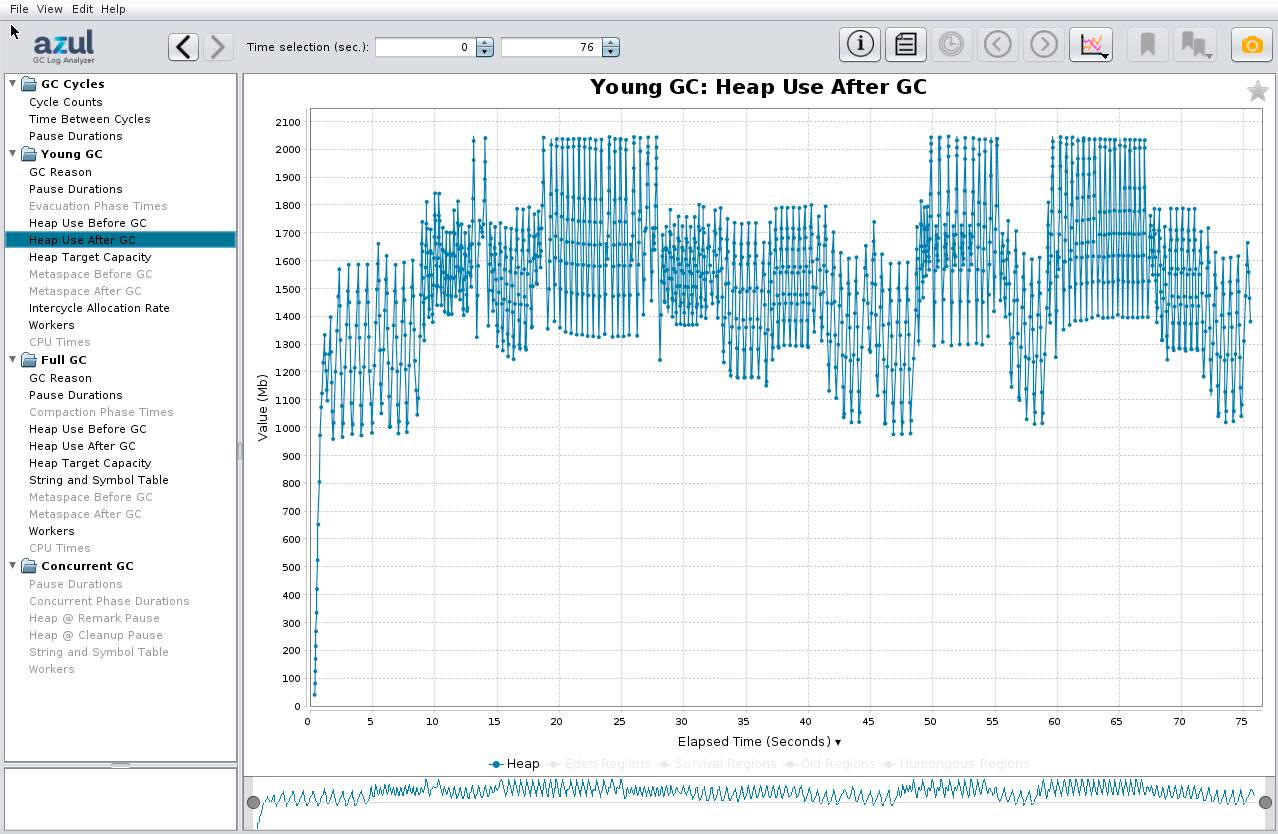
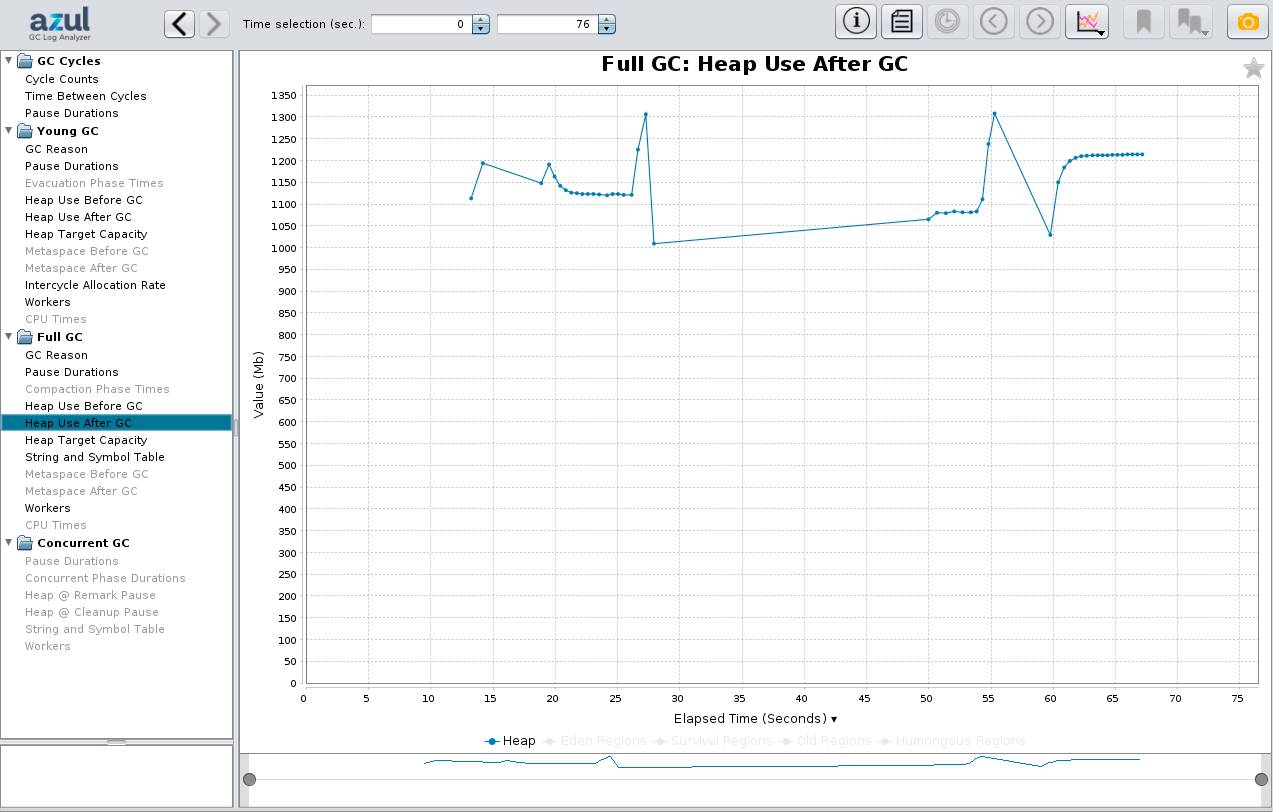
When we generate a GC log with Zulu, a build of OpenJDK, we get the same data in the log file as most other distributions. The following charts show us that the garbage collector pause durations stay below 80ms, and the heap utilization after garbage collection stays around 1GB for the long-living objects in Old Generation and 2GB in New Generation for temporary objects.
In this specific test case, a total of -Xmx4G is sufficient and actually used, but usually the standard recommendation would be to set -Xmx to twice the observed heap utilization; here, it would be -Xmx6G.
Results With Zing
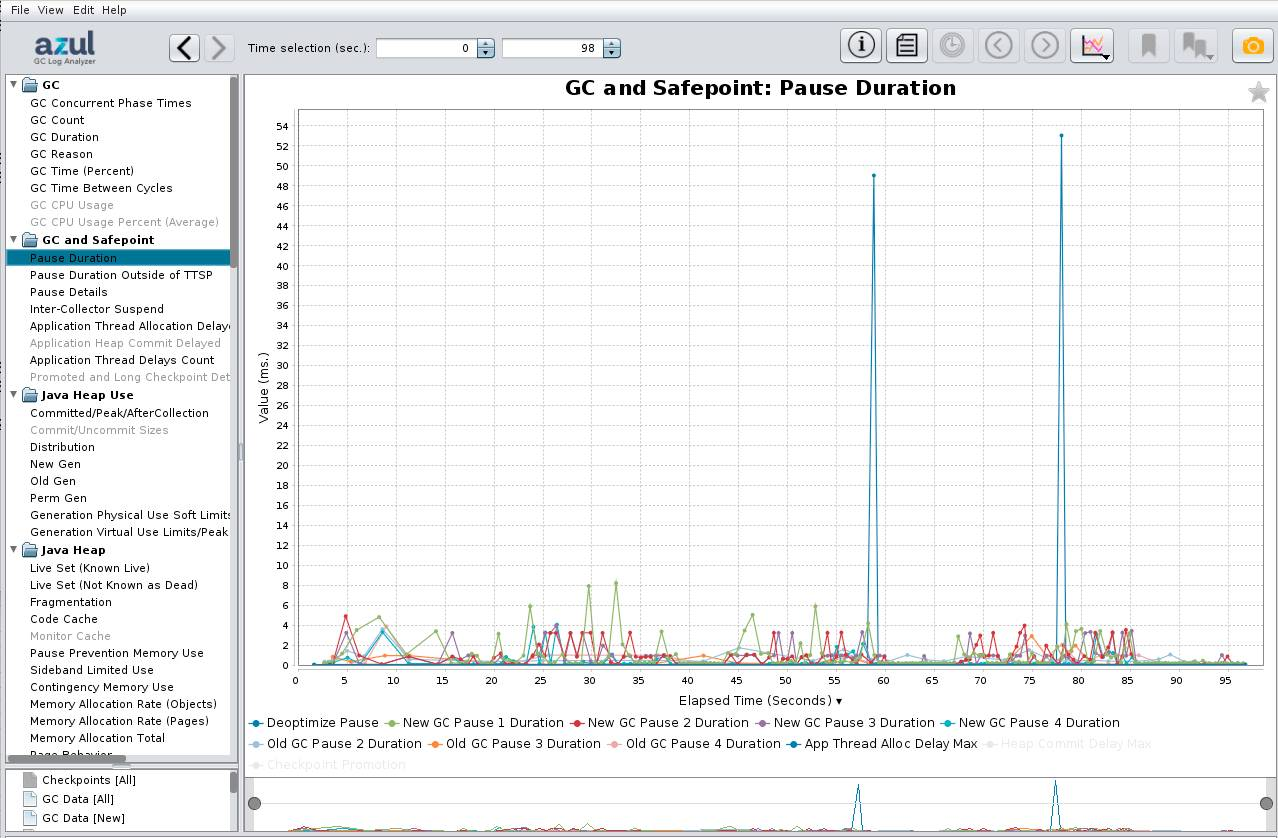
We repeated the same test with Zing, an alternative Java runtime that is based on OpenJDK but has a better JIT compiler (Falcon) and additional garbage collector (C4, Continuously Concurrent Compacting Collector).
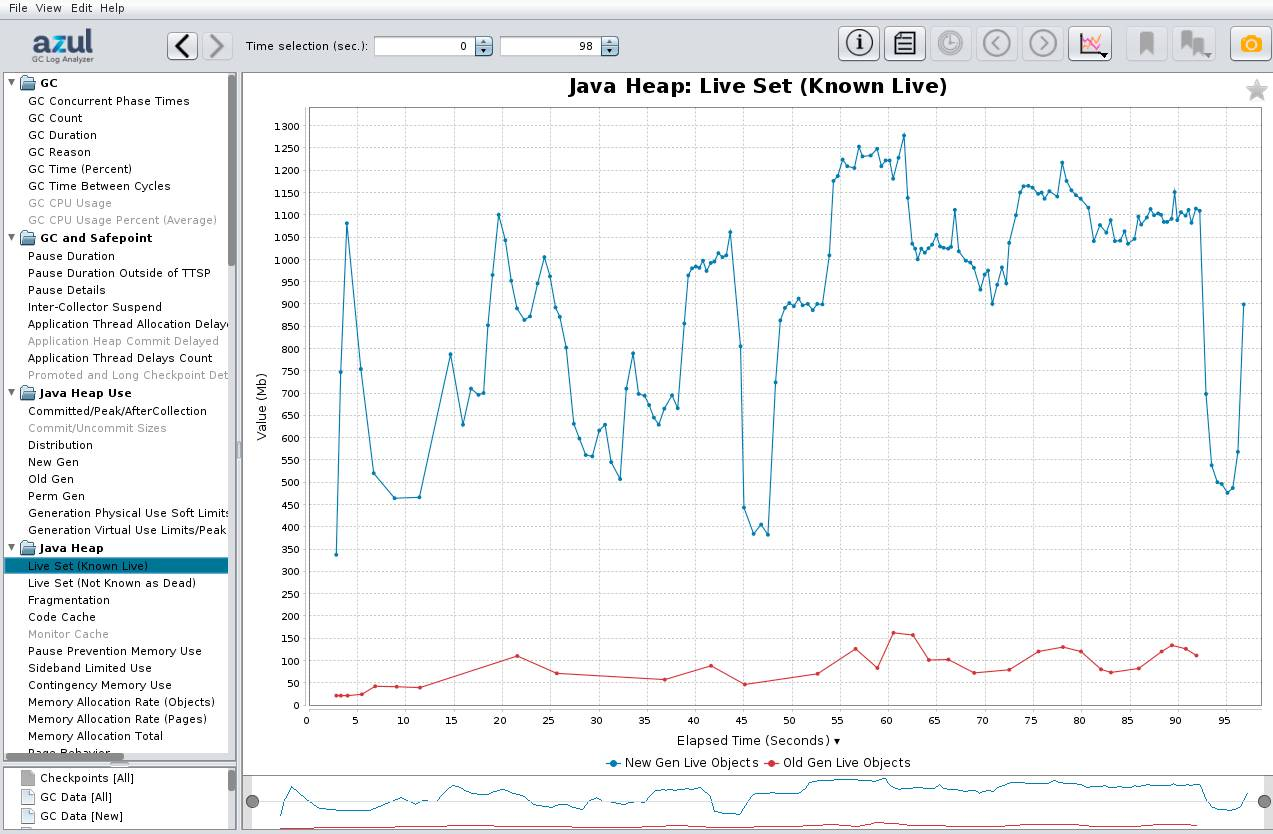
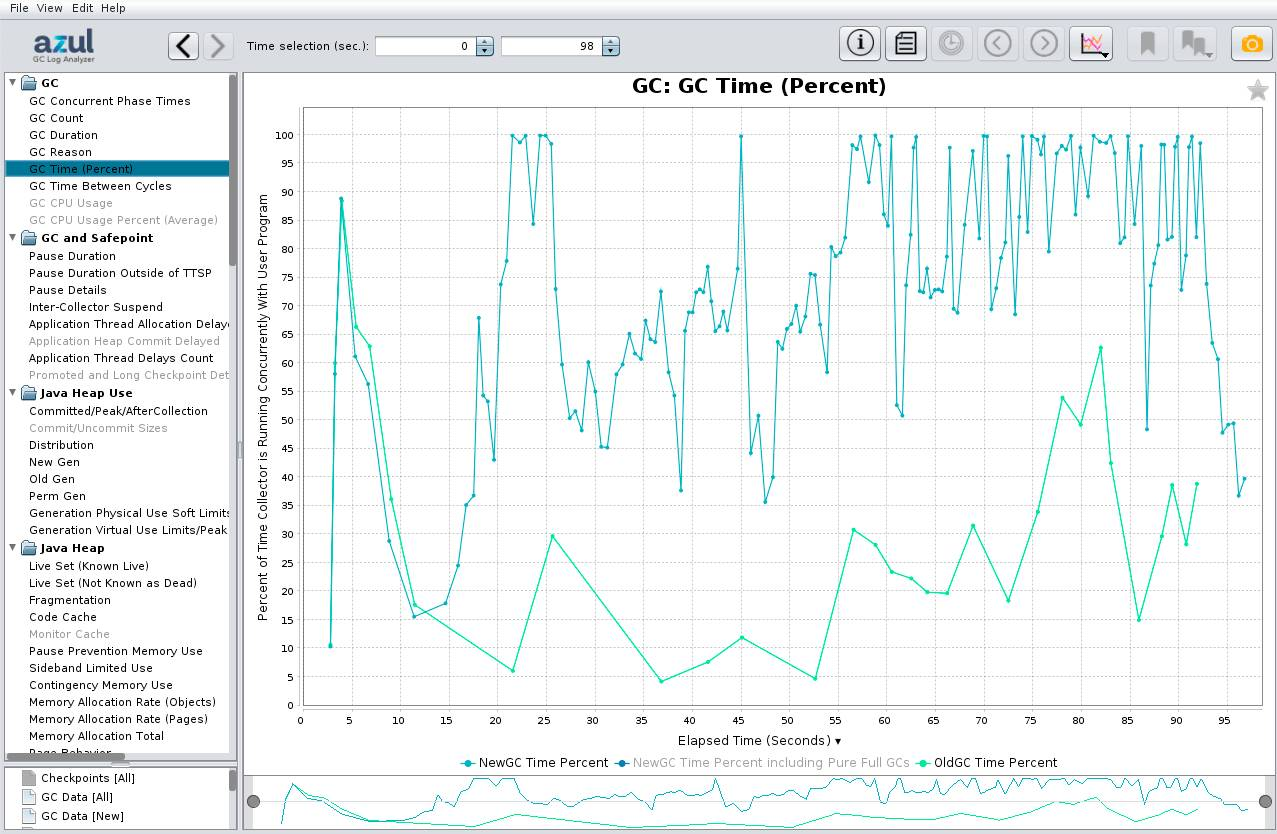
The graphs look slightly different due to extra information provided by the C4 Garbage Collector. With concurrent GCs, the concurrent duration while the GC is active in parallel to the application is a more important metric. It doesn’t pause the application but consumes a bit of CPU time. The 100% doesn’t mean it consumes 100% of all CPU time, as the base 100% is the total number of GC threads, which is less than the number of CPU cores. But staying at 100% for long time periods should be avoided by increasing the heap size. Most of that time is usually spent by the GC to handle temporary objects. Here, in this specific test case, the application performance was still better with Zing, compared to Zulu with the same -Xmx4G.
For the general sizing, the Live Set graph for Zing is also important as it shows the number of live objects, for instance without the nonreferenced objects, also known as garbage.
Conclusion
Garbage collector logging provides the correct metrics to check how much memory an application needs. It is crucial to be able to test the application in the same environment and with a similar load to the production system. Maybe “testing in production” could be the easiest approach to achieve this.
YOUTUBE.COM/THENEWSTACK
Tech moves fast, don’t miss an episode. Subscribe to our YouTubechannel to stream all our podcasts, interviews, demos, and more.