
包阅导读总结
1.
关键词:Grafana Alloy 1.3、实时调试、数据管道、开源、OpenTelemetry
2.
总结:Grafana Alloy 1.3 发布,介绍其作为开源的 OpenTelemetry Collector 分布,新增实时调试功能,可实时监测数据管道,能更高效排查故障和深入了解数据流,还提到配置方法、支持的组件以及如何构建管道。
3.
主要内容:
– Grafana Alloy 1.3 发布
– 是 OpenTelemetry Collector 的开源分布
– 具有 OpenTelemetry 和 Prometheus 格式的原生管道
– 沿用 Grafana Agent Flow 的组件、代码和概念
– 新功能:实时调试
– 增强关键组件调试能力
– 可实时监测数据管道,包括可视化数据转换、识别隔离错误、分析行为
– 提高故障排查效率,提供更深入的数据流洞察
– 配置方法
– 默认禁用,需在配置中添加 live debugging 块启用
– 需将稳定性级别设为 experimental
– 通过特定网址打开 UI 并操作
– 支持实时调试的组件
– loki.process、loki.relabel、otelcol.processor、otelcol.receiver、prometheus.relabel
– 构建管道
– 此前需构建整个管道再检查,现可逐步添加组件并验证数据
– 提供相关视频教程
– 学习更多
– 参考文档了解更多新特性
– 欢迎反馈,Grafana Cloud 可免费注册
思维导图: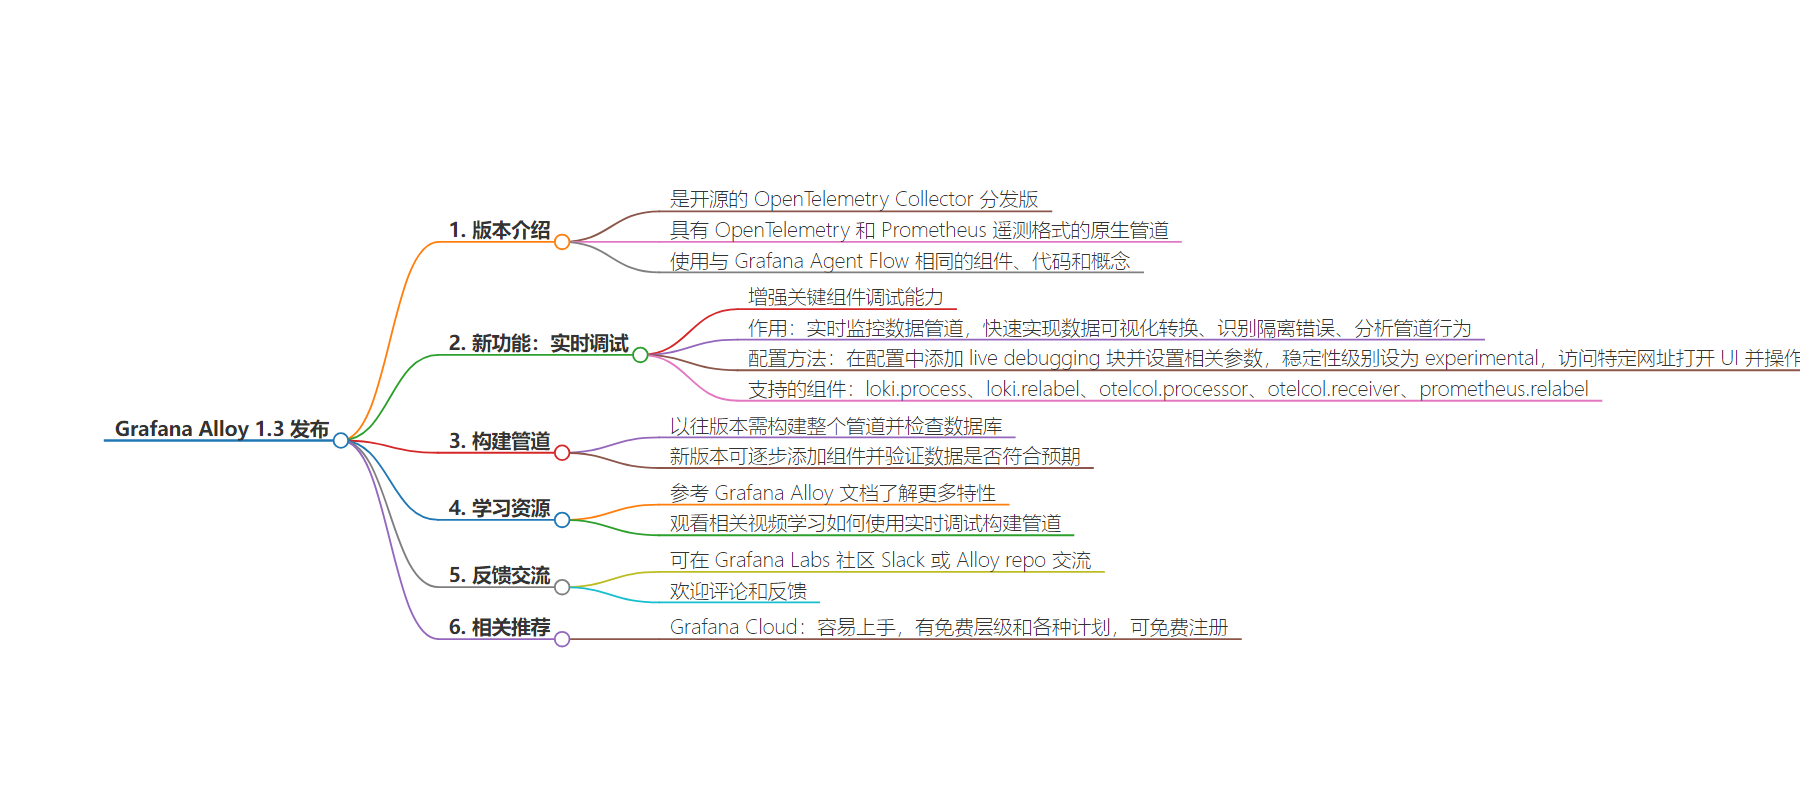
文章地址:https://grafana.com/blog/2024/08/05/grafana-alloy-1.3-release-debug-pipelines-in-real-time/
文章来源:grafana.com
作者:William Dumont
发布时间:2024/8/5 20:29
语言:英文
总字数:451字
预计阅读时间:2分钟
评分:86分
标签:Grafana Alloy,实时调试,数据管道,OpenTelemetry,Prometheus
以下为原文内容
本内容来源于用户推荐转载,旨在分享知识与观点,如有侵权请联系删除 联系邮箱 media@ilingban.com
Grafana Alloy 1.3 is here!
First introduced earlier this year, Alloy is our open source distribution of the OpenTelemetry Collector. It has native pipelines for OpenTelemetry and Prometheus telemetry formats, and it uses the same components, code, and concepts that were previously introduced in Grafana Agent Flow.
This new release introduces live debugging, enhancing debugging capabilities across key components, which are the building blocks of Alloy. This feature allows for real-time monitoring of your data pipelines so you can quickly:
- Visualize data transformations
- Identify and isolate errors
- Analyze pipeline behavior
Live debugging makes troubleshooting more efficient and provides deeper insights into data flow so you can streamline your development and optimization processes.
Configure live debugging
Live debugging is disabled by default to avoid accidentally displaying sensitive telemetry data. You can enable it by adding the live debugging block to your config:
livedebugging { enabled = true}Since this feature is experimental, you will need to set the stability level to experimental:
alloy run config.alloy --stability.level experimentalVisit http://localhost:12345/ to open the UI. Press the Live Debugging button on a component page to start a session for that component.
You can scroll through, filter, and sample the data. You can also manage the flow using the pause/unpause feature and the Clear button.
The following components support live debugging in this version:
loki.processloki.relabelotelcol.processorotelcol.receiverprometheus.relabel
Note: Both
otelcol.processorandotelcol.receiverinclude all corresponding components.
Build your pipelines step by step
In the previous version of Alloy, you had to build your entire pipeline and check your databases in the hope that the telemetry data was delivered in the expected format. But with live debugging, you can add components incrementally and verify that the data meets your expectations before sending it to the cloud.
Watch the following videos to learn more about how to build pipelines with live debugging. In the first one, you’ll see how to send Prometheus metrics to Grafana Cloud using Alloy.
VIDEO
And if you’re using OpenTelemetry, this second video will show you how to receive OpenTelemetry Protocol (OTLP) metrics from your application and send them to Grafana Cloud with the help of live debugging.
VIDEO
Learn more about Grafana Alloy
To learn more about other features in the latest release, please refer to our Grafana Alloy documentation.
As always, we’d love to hear from you, so feel free to drop by our Grafana Labs community Slack or check out the Alloy repo directly. We look forward to your comments and feedback!
Grafana Cloud is the easiest way to get started with metrics, logs, traces, dashboards, and more. We have a generous forever-free tier and plans for every use case. Sign up for free now!