
包阅导读总结
1. 关键词:Ngrok、Traffic Inspector、Observability、Network Traffic、New Features
2. 总结:Ngrok 的 Traffic Inspector 为网络流量提供可观测性,基于用户反馈新增能力并正式推出。它能捕获 HTTP 流量及相关元数据,还可回放事件。在预览期间增加了新功能,如实时更新、延长保留天数、修改后重放请求等,未来还将有更多新功能。
3. 主要内容:
– Ngrok Traffic Inspector 为 API 或服务的流量提供可观测性,以助理解和识别问题
– 提供跨端点的 HTTP 流量视图,默认捕获请求元数据,可配置捕获完整请求和响应体,能回放事件重现异常行为
– 创建目的是为多个 ngrok 代理提供可观测性,收集所有端点流量,集中观察数据
– 三个月开发者预览期间新增功能
– 实时更新,调试应用实时且过滤事件时自动暂停
– 延长流量保留窗,从 3 天最多到 90 天
– 可修改并重放请求,便于重现事件和控制调查服务行为
– 未来将有包括高级过滤、与云边缘和端点更好集成等新功能
思维导图: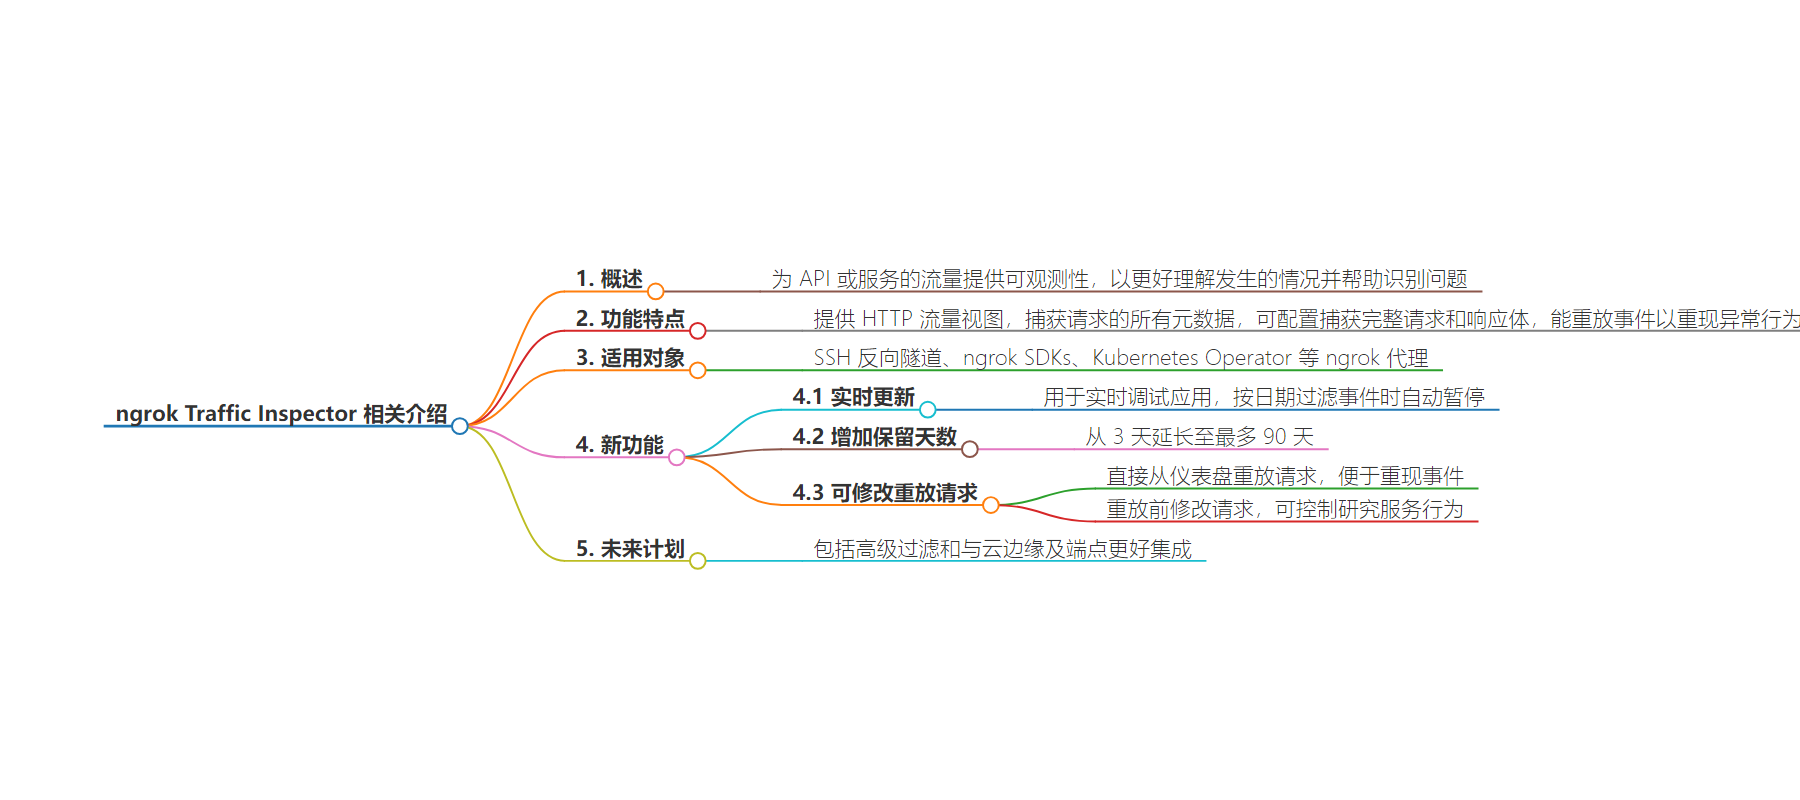
文章来源:infoq.com
作者:Sergio De Simone
发布时间:2024/7/17 0:00
语言:英文
总字数:406字
预计阅读时间:2分钟
评分:84分
标签:网络监控,API 可观测性,DevOps 工具,网络安全,微服务监控
以下为原文内容
本内容来源于用户推荐转载,旨在分享知识与观点,如有侵权请联系删除 联系邮箱 media@ilingban.com
The ngrok Traffic Inspector provides observability for traffic towards APIs or services to better understand what is happening and help identify any issues. Since it was previewed earlier this year, the Traffic Inspector has acquired new capabilities based on user feedback and is now officially available through the ngrok dashboard.
Traffic Inspector provides a view of the HTTP traffic across the endpoints belonging to an ngrok account. The inspector captures all metadata associated with requests by default and can be configured to capture full request and response bodies. Additionally, it can replay events to reproduce anomalous behavior.
As ngrok product manager Russ Savage explains, Traffic Inspector was created to provide observability to several ngrok agents, including SSH Reverse Tunnel, ngrok SDKs, and Kubernetes Operator. Since those agents did not provide observability on their own, ngrok created the Traffic Inspector as a gateway that collects traffic from all endpoints. This approach has the added benefit of consolidating all observed data into a single location.
/filters:no_upscale()/news/2024/07/ngrok-traffic-inspector/en/resources/1ngrok-traffic-inspector-1721203804290.jpg)
During the three-month developer preview, ngrok has implemented a few new features in its Traffic Inspector, including live updating, additional retention days, replay requests with modifications, and filtering by specific time range.
Live update is useful to debug applications in real-time and pauses automatically when you filter events by date to investigate production issues. Ngrok also extended the traffic retention window from three days to a maximum of 90. As Savage explains, the initial limitation to three days during the preview phase was meant to ensure the system kept its performance even for users with a significant amount of traffic while giving ngrok the chance to analyze and optimize data storage and queries.
Another useful new feature is the possibility of replaying requests with modifications. Replaying requests directly from the ngrok dashboard makes it easy to reproduce events without going through possibly complex activation scenarios, e.g., accessing a third-party service to trigger a webhook in your API, or waiting for an anomalous event to happen again.
Being able to modify the requests before replaying them adds another level of control to investigate how a service behaves in a certain way. This includes changing headers, updating credentials, or changing values in the body, as well as sending the request to a different endpoint with a potential fix.
As a final note, ngrok is already at work on new features for its Traffic Inspector, including advanced filtering and better integration with cloud edges and endpoints.