包阅导读总结
1. 关键词:系统设计、工具、XY 问题、复杂性、现代软件系统
2. 总结:本文探讨了工程团队在系统设计工具选择上常遇到 XY 问题,强调系统设计并非单纯绘图,还包括持续的过程和多方面的产出。指出传统绘图工具的局限,现今软件系统的复杂需要能拥抱复杂性、支持动态设计和增强系统可观测性的工具,同时分析了团队坚持使用现有绘图工具的原因。
3. 主要内容:
– 工程团队选择软件系统管理工具时面临 XY 问题,常关注解决方案而非实际痛点。
– 举例说明 XY 问题的表现。
– 系统设计与系统架构图的关系。
– 系统设计超越特定工具和文档,是持续的过程。
– 输出包括系统需求文档等。
– 如今绘图工具的不足。
– 软件开发需要清晰有效的沟通,绘图有局限性。
– 随着系统复杂度增加,传统绘图工具存在诸多问题。
– 工程团队需要更适合的工具。
– 拥抱复杂性,支持动态系统设计。
– 能提供最新信息和促进协作解决问题。
– 工程团队坚持使用绘图工具的原因。
– 包括沉没成本谬误、抗拒改变、问题定义不清。
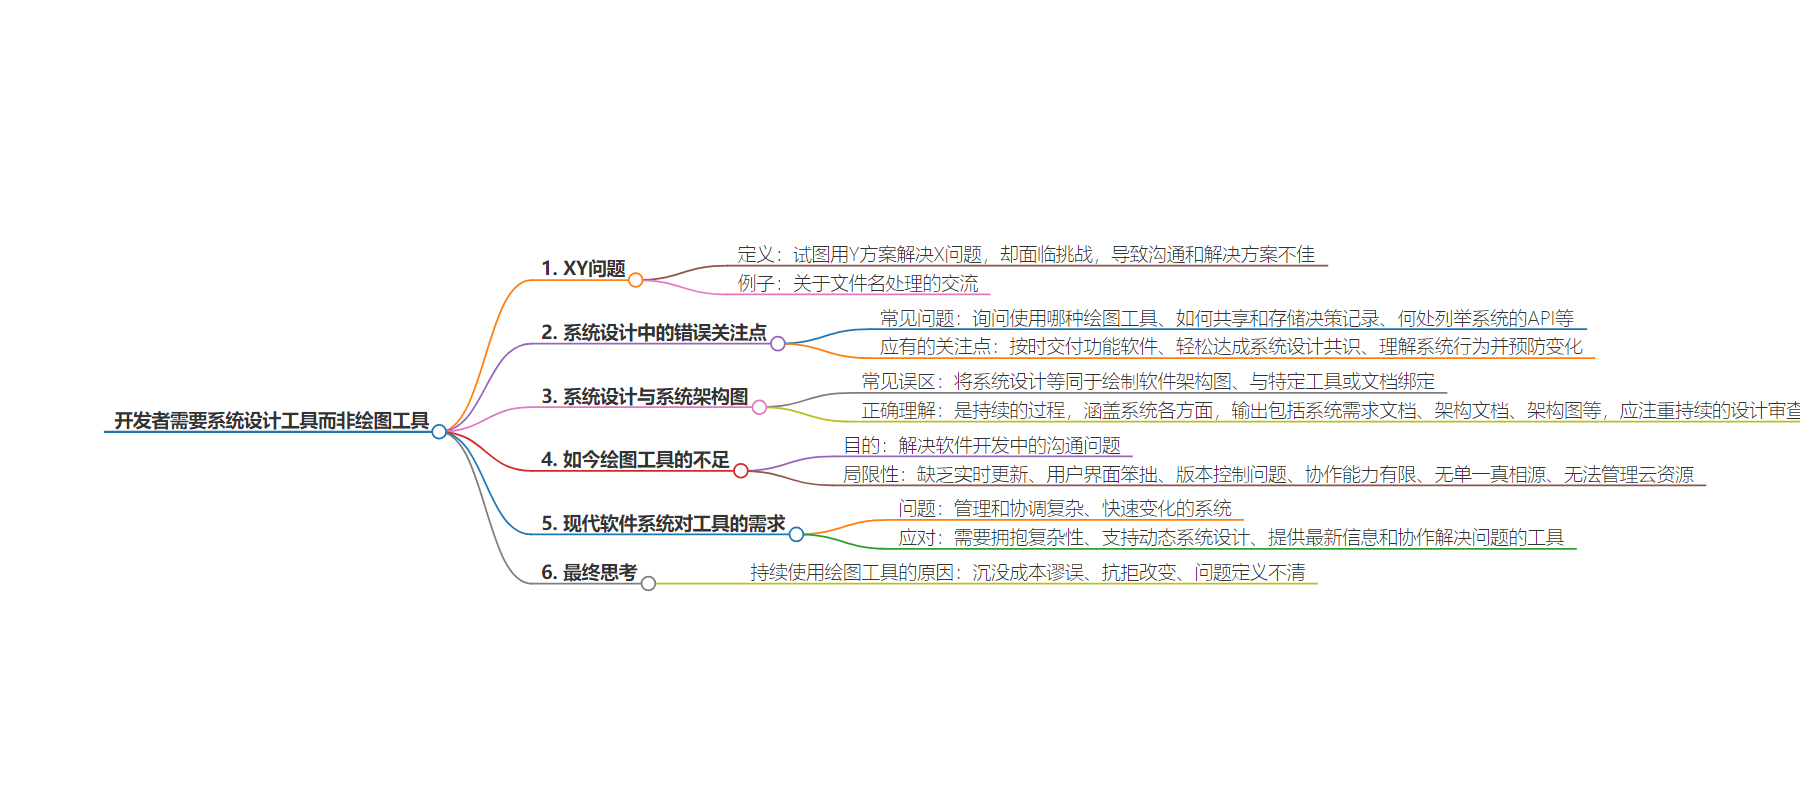
思维导图:
文章地址:https://thenewstack.io/devs-need-system-design-tools-not-diagramming-tools/
文章来源:thenewstack.io
作者:Thomas Johnson
发布时间:2024/7/22 15:52
语言:英文
总字数:1643字
预计阅读时间:7分钟
评分:85分
标签:系统设计,软件工程,图表工具,系统架构,现代软件系统
以下为原文内容
本内容来源于用户推荐转载,旨在分享知识与观点,如有侵权请联系删除 联系邮箱 media@ilingban.com
When engineering teams select tools for managing their software systems, particularly for design and visualization, they often encounter the XY problem.
The XY problem arises when someone attempts to solve problem X using solution Y but faces challenges. Instead of seeking help for problem X, they request support for solution Y, obscuring the root cause and leading to miscommunication and suboptimal solutions.
Here’s a concrete example from the XY problem website:
|
<bob> How can I echo the last three characters in a filename?
<feline> If they‘re in a variable: echo ${foo: -3}
<feline> Why 3 characters? What do you REALLY want?
<feline> Do you want the extension?
<bob> Yes.
<feline> There’s no guarantee that every filename will have a three–letter extension,
<feline> so blindly grabbing three characters does not solve the problem.
<feline> echo ${foo##*.} |
In their system architecture or visualizing its components, they often ask:
- Which diagramming tool should we use to map our system architecture?
- How do we share and store architectural decision records?
- Where can we list all of the APIs in our system?
These questions, while valid, focus on Y — the proposed solution — rather than X — the actual pain points the team aims to address. To uncover the root cause, these questions should be reframed as follows:
- We need to ship functional software on a schedule, so we need an easy way to visualize and access up-to-date information about our system architecture.
- We need to reach a consensus on the system design effortlessly and have a single source of truth for decision records.
- We need to understand the system behavior and catch breaking changes before they occur.
Unfortunately, many teams don’t realize they are focusing on Y instead of X. This leads them to adopt a fragmented approach to system design, implementing various solutions for individual tasks. They might use one tool for sketching, another for system architecture, and another for sequence diagrams. System requirements and design decisions are scattered across Google Docs, Jira, Linear, Slack, email, Confluence, and more. APIs might be listed in spreadsheets or specialized tools.
This approach results in significant time and effort spent maintaining these resources, searching for relevant information, and unnecessary context switching.
System Design vs. System Architecture Diagrams
System design is often mistakenly equated with simply drawing diagrams of software architecture. Another misconception is to align it solely with BDUF (Big Design Up Front), UML (Unified Modeling Language), specific architectural frameworks like TOGAF, or various documentation types such as HLD (High-Level Design), SAD (Software Architecture Document), KDD (Key Design Decisions), ARD (Architecture Requirements Document), LLD (Low-Level Design), and ADR (Architecture Decision Record).
System design transcends any specific tool or document; it is an ongoing process that outlines the high-level conceptual structure of a complex system (the system architecture) and defines its significant components and interactions. It encompasses all aspects of the system (i.e., software, hardware, data, interfaces, and user interactions) to ensure that they work together effectively and efficiently to meet the application’s requirements.
Outputs of this process may include:
- System Requirements Documentation (i.e., Detailing both functional and non-functional requirements.)
- System Architecture Documentation (i.e., Describing the goals, constraints, and rationale behind the chosen architecture.)
- System Architecture Diagram (i.e., Providing a visual representation of components, services, their interactions, and relationships.)
However, system design should focus on upfront and continuous system design reviews that continually record and revisit the system requirements, decisions, trade-offs, and compromises. It’s an essential step in software development to assess a system’s technical feasibility, functionality, and performance and identify dependencies and risks to make informed decisions.
Relegating system design to merely producing diagrams or documents risks overlooking critical information and fosters inefficient practices within engineering teams. This ultimately leads to accruing architectural technical debt and burdening teams with manual tasks and ineffective resources.
Nowadays, Diagrams Are Not Enough
Developers often use diagrams to tackle a fundamental communication challenge: conveying the complexities of a distributed software system — including its components, dependencies, and APIs — clearly and effectively to a distributed team.
Software development is inherently collaborative, requiring a shared understanding of the system’s construction, constraints, and future evolution. This alignment is crucial for eliminating ambiguity and enabling cohesive team progress.
Visual illustrations are powerful tools for achieving this alignment, as they help bypass the potential misunderstandings and delays inherent in written and verbal communication, ensuring that mental models are aligned across the team. However, diagramming tools have significant limitations. Effective diagrams are designed to tell a specific story to a particular audience, providing a static snapshot of a software system that addresses the concerns of specific stakeholders (e.g., Backend team, Frontend team, QA, PMs, DevOps, C-suite).
In the past, when software systems were smaller and more straightforward, a single diagram could (potentially) capture all necessary information. Today, with the proliferation of SaaS, APIs, composable platforms, and legacy systems, the complexity of software systems has exponentially increased.
“Software tech stacks today look way more like a rainforest — with animals and plants co-existing, competing, living, dying, growing, interacting in unplanned ways — than like a planned garden.”
— Jean Yang.
We’ve all seen diagrams that attempt to fit the entire architecture of these modern software systems into a single picture. Ironically, these systems would benefit the most from effectively communicating their complexity.
As systems scale and team requirements evolve, the limitations of traditional diagramming tools become more apparent:
- Lack of Real-Time Updates: Diagrams provide a static representation and cannot automatically reflect the dynamic nature of modern systems.
- Clunky User Interface: Updating diagrams can be cumbersome, with significant time formatting and arranging components.
- Version Control Issues: Maintaining updated versions across teams is challenging.
- Limited Collaboration Capabilities: Real-time collaboration and feedback often need better support.
- There is no single source of Truth. Diagrams rarely include information about requirements, trade-offs, design decisions, etc. Design documentation is often used.
- Incapable of Managing Cloud Resources: Diagrams do not control or generate infrastructure code (e.g., CloudFormation, Terraform).
These limitations highlight that diagramming tools were not designed to handle the complexities of modern software systems and their architectural evolution.
Engineering teams today need tools that embrace complexity and support dynamic system design, exceeding the capabilities of traditional diagramming tools. While developers can build bigger systems thanks to all the new technologies available, they now face the issue of managing and coordinating these fast-moving, constantly evolving, pieced-together systems. In most of these real-world, messy tech stacks, developers must integrate new code with legacy code while continuously evaluating when and how to modernize existing components.
A lack of visibility and understanding of their software systems creates team bottlenecks, slows development, and results in fragile, inflexible systems. The typical response to manage this complexity is to seek higher levels of abstraction. However, simplifying things away is only sometimes the best solution.
Some problems cannot be automated, and developers must gather the appropriate information to provide tailored input on how to solve them. For instance, consider debugging: a high-level, static abstraction of a software system doesn’t equip an engineer with the detailed understanding needed to troubleshoot issues effectively. Furthermore, problems may require different abstractions, meaning no single abstraction can address all needs.
It’s similar to understanding how your car works: you don’t need to know every detail, but you should be able to check under the hood to diagnose issues, especially without needing to take the car back to the dealership every time. Therefore, we need complexity-embracing tools that combine abstraction with the capability to delve into the tech stack. These tools should provide up-to-date information on any component, structure, or relationship and foster collaborative problem-solving.
Unlike general-purpose diagramming and whiteboarding tools, we need tools that distinguish between the relationships of elements in an org chart versus those in a platform architecture. Enhanced system observability and understanding tools are essential, empowering developers to explore, uncover, and manage complexity effectively.
Final Thoughts
Many engineering teams persist in using diagramming tools due to a combination of sunk cost fallacy (” We’ve already invested 30 hours in creating and updating this diagram, so we might as well continue and not waste that time”), resistance to change (” Switching tools takes time and training, we have other priorities now”), and unclear problem definition (”we need an updated diagram” vs. “we need a real-time understanding of our system”).

The sunk cost fallacy is the tendency for people to continue an endeavor or course of action even when abandoning it would be more beneficial.
As the complexity of modern software systems grows, more teams will encounter the limitations of traditional diagramming tools. Once essential for illustrating ideas and designs, these tools still need to be improved to capture the full complexity of systems, hindering developers from fully understanding, designing, developing, and managing them.
Diagramming tools must evolve to support the comprehensive activities required in the system design process and empower teams to effortlessly answer deeper questions about their software architecture.
Today, we have the technology and knowledge to create tools that prevent developers from wasting valuable development time deciphering static, outdated diagrams, manually updating documents, or gathering information from scattered sources. Instead, we can enable teams to focus on meaningful discussions, driving towards solving complex problems and making informed design decisions for the system’s evolution.
YOUTUBE.COM/THENEWSTACK
Tech moves fast, don’t miss an episode. Subscribe to our YouTubechannel to stream all our podcasts, interviews, demos, and more.
