
包阅导读总结
1.
“`
Observability、Testing、Distributed Applications、Trace-Based Testing、Test Observability
“`
2. 本文主要探讨了云原生应用和服务测试中存在的问题,介绍了利用Observability表面进行测试的两种关键能力(测试可观测性和基于跟踪的测试)及其优势,还提到了Tracetest解决方案如何结合传统测试与Observability表面,并说明了其使用方法。
3.
– 云原生测试通常在UI或API层面进行,存在对底层组件测试的盲点。
– Observability和OpenTelemetry旨在获取应用内部运作的详细洞察,形成“Observability表面”。
– 利用此表面进行测试有两个关键能力:
– 测试可观测性:每次测试运行提供分布式跟踪,带来端到端可见性、错误检测等好处。
– 基于跟踪的测试:可针对Observability表面数据测试,有端到端可测试性等优势。
– Tracetest结合传统测试与Observability表面,可与多种测试工具结合,适用于SaaS平台或本地部署。
思维导图: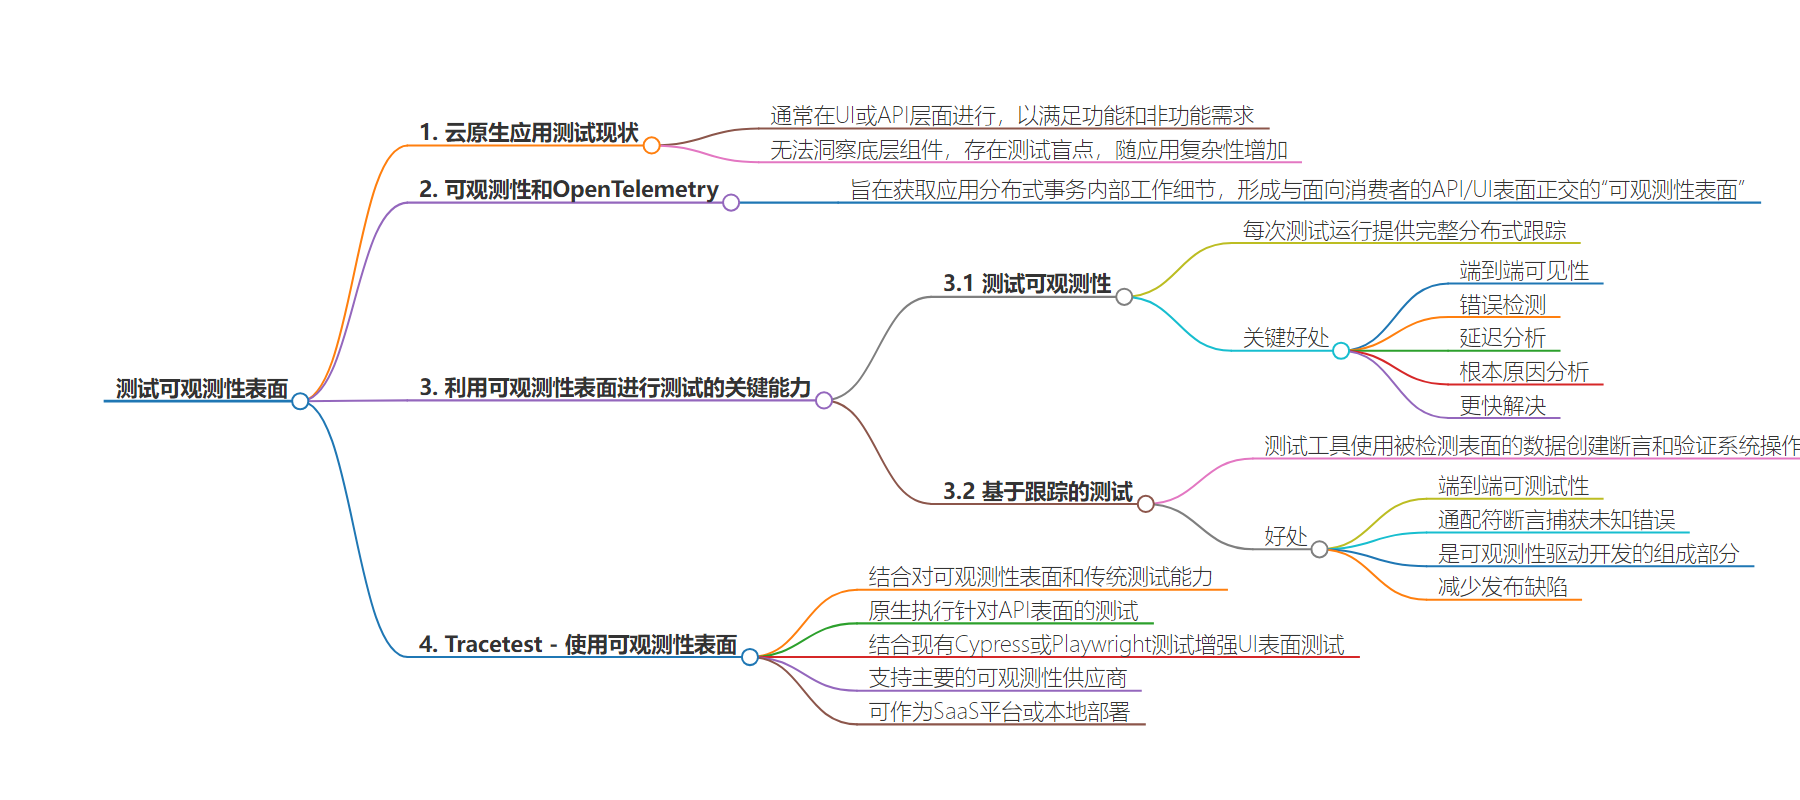
文章地址:https://thenewstack.io/testing-the-observability-surface/
文章来源:thenewstack.io
作者:Ken Hamric
发布时间:2024/6/17 18:00
语言:英文
总字数:1032字
预计阅读时间:5分钟
评分:81分
标签:sponsor-kubeshop,sponsored-post-contributed
以下为原文内容
本内容来源于用户推荐转载,旨在分享知识与观点,如有侵权请联系删除 联系邮箱 media@ilingban.com
Testing cloud native applications and services is usually done at the UI or API level to ensure that both of these “surfaces” meet both their functional and nonfunctional requirements.
Unfortunately, these tests have no insight into the underlying components involved in the tested transactions. It results in a huge blind spot for testing that grows with the complexity and distributed nature of your application infrastructure.
Observability, in general, and OpenTelemetry, in particular, aim to gain detailed insights into the internal workings of an application’s distributed transactions. They’re exposed as an “observability surface” that is orthogonal to the consumer-facing API/UI surfaces mentioned above.
Harnessing the observability surface for testing purposes enables two key capabilities that greatly enhance testing for distributed applications:
- Test observability
- Trace-based testing
Test Observability
Test observability provides a new artifact for every run of a test — a full distributed trace.
Traces provide a detailed view of the flow of requests across different services in a distributed system. They help in understanding the entire journey of a request from start to finish. This is crucial for diagnosing issues, optimizing performance and ensuring reliability. When a trace is captured for each test, test observability provides several key benefits:
- End-to-end visibility: The entire path of execution triggered by the test is captured. You can see the request path taken through the various microservices, including the time spent in each service and the interactions between them.
- Error detection: Errors and exceptions occurring in the system are highlighted, providing context around the failure points and aiding in quicker resolution for failed tests.
- Latency analysis: Traces clearly show the amount of time spent at each step in the execution of the test, allowing bottlenecks and performance hotspots to be identified.
- Root-cause analysis: With detailed information on timings and errors, issues are traced back to their root cause, whether it’s a specific service, database query or external API call.
- Faster resolution: Tests fail. Having information tied to each test which can help identify the root cause and determine which team to ask to help resolve the issue improves mean time to resolution (MTTR).
Test observability, much like the traditional use of observability, is a tool that is used reactively, once a test breaks, in a largely manual troubleshooting effort. The second key capability, trace-based testing, enables proactive use of this new test artifact.
Trace-Based Testing
All test tools use data from the surface under examination to create assertions and verify proper system operation.
API tests normally operate as black box tests against the API surface, limited to checking attributes returned from an API call such as the status code, duration of the call or response body data.
End-to-end (E2E) tests against the browser/UI surface typically have more insight and visibility into the browser engine itself. They can assert against page content and response from network calls, and some can look at performance information pulled from sources such as Chrome DevTools Protocol (CDP).
Trace-based tests allow testing against the data exposed and captured from the observability surface. Orthogonal to the consumer-facing API/UI surfaces, the observability surface has visibility into the entire flow. This provides several important benefits:
- End-to-end testability: Reflecting the entire process flow via your OpenTelemetry instrumentation allows assertions to be placed to verify proper operation. Assertions can be both functional and nonfunctional. Here are some examples:
- Verify that a call to an external vendor responds correctly, verifying the success of the call, the data returned or the duration.
- Verify that important asynchronous processes were called and finished correctly, verifying systems that may not reflect back errors to the API or UI surface.
- Wildcard assertions to catch unknown errors: Trace-based test specs have two components — the selector and the assertion. The selector enables you to declare exactly to which spans the assertion should be applied. Typically, assertions are specific to a certain process, but having wildcard assertions is very powerful. You can assert that
- All gRPC calls involved in this transaction were successful.
- All Postgres transactions occurred faster than 100ms.
- Integral to observability-driven development: Observability has traditionally been an afterthought, needed by the site reliability engineers but dependent on the development organization for instrumentation. Enabling powerful integration and E2E tests which leverage observability to be created by developers shifts this dynamic, providing value from instrumentation across the various roles.
- Minimize released defects: Trace-based tests use the orthogonal view of the observability plane to allow deeper, more thorough testing, looking for and asserting against function and nonfunctional specifications, while also capable of checking for “unknown/unknowns.” This proactive use of observability allows for issues to be caught in your CI/CD processes before being released into production.
Tracetest — Using the Observability Surface
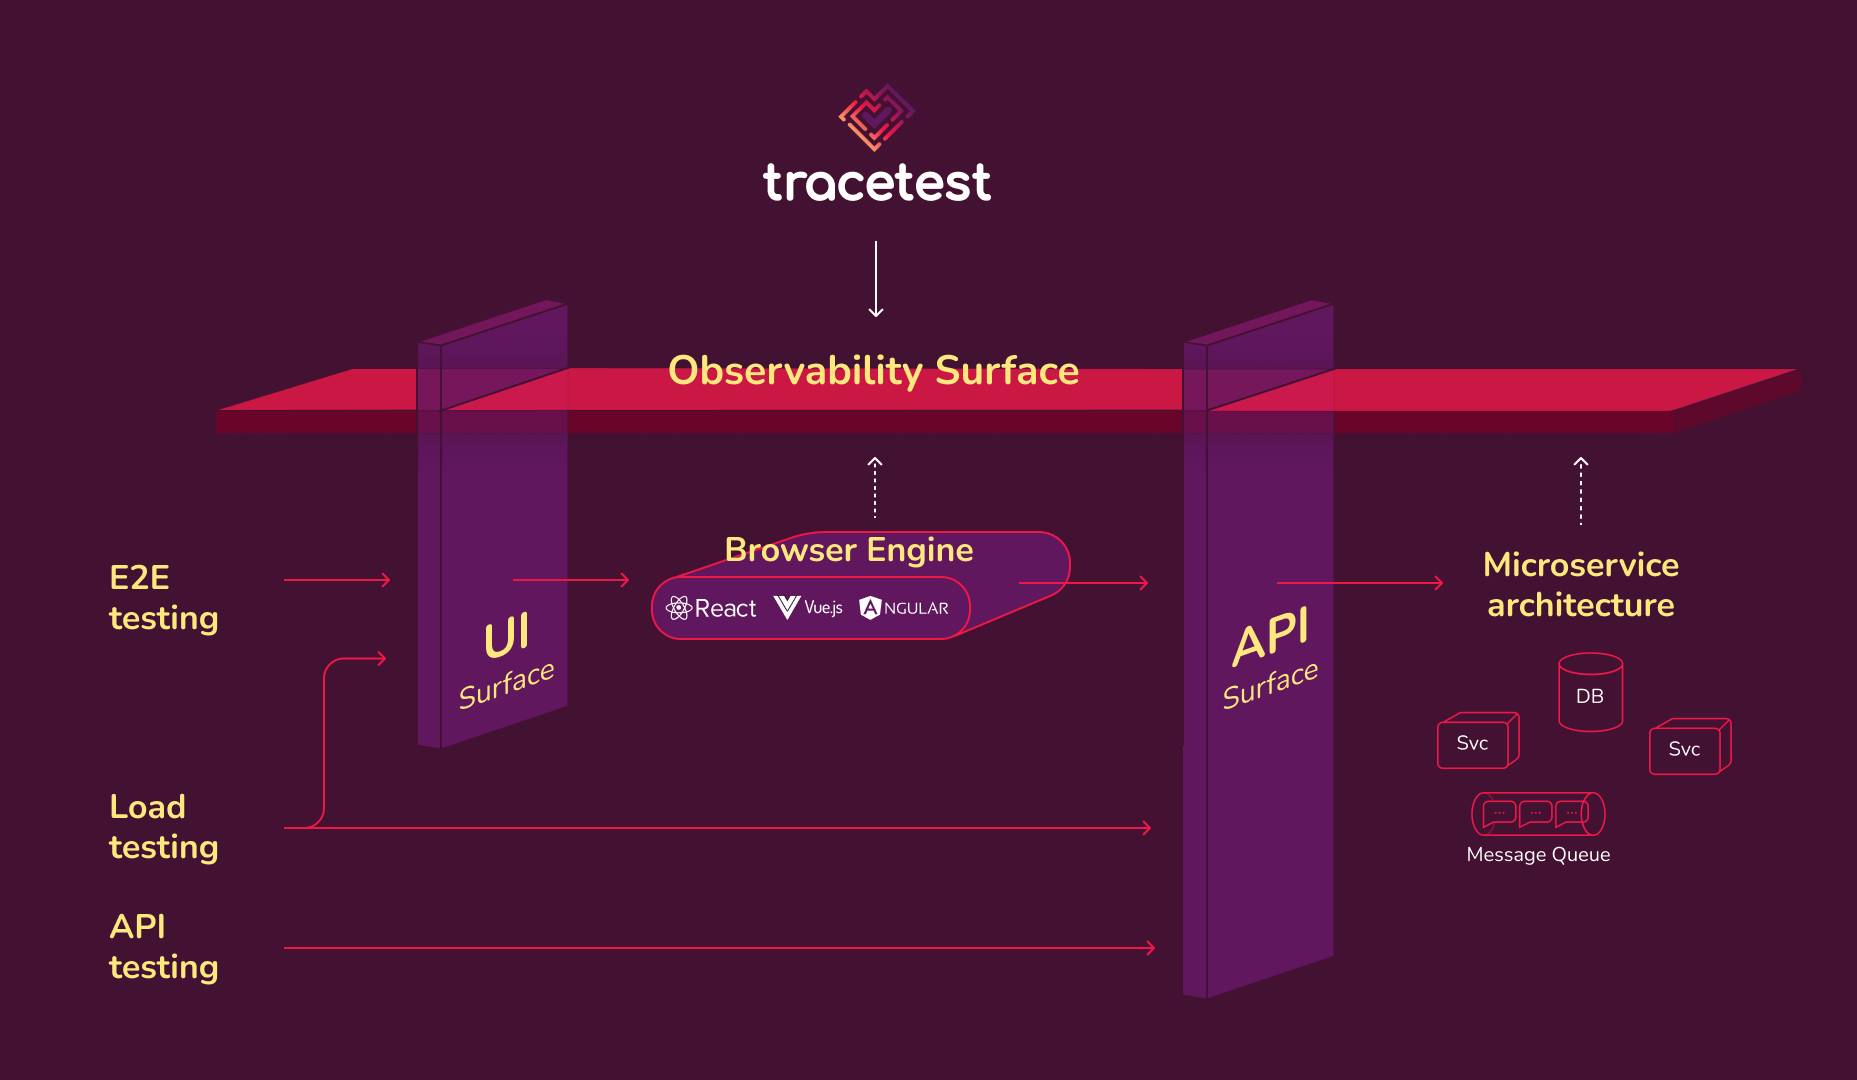
Tracetest is a solution that combines its focus on the observability surface with traditional test capabilities that target the API or UI surfaces, combining the strengths of the two orthogonal approaches.
Tracetest natively executes tests against the API surface, triggering tests via your REST API, gRPC endpoint or by placing a message in a queue. It can even import your current Postman tests or run tests against your functions as a service-based architecture.
To enhance tests against the UI surface, Tracetest combines with your existing Cypress or Playwright tests. With the observability surface being exposed and leveraged by an embedded Tracetest test, your enhanced E2E test can now validate the front end, the API surface and your full back-end flow, providing visibility and assertions across the entire process.
Want to start using Tracetest to add both test observability and trace-based testing in your CI/CD pipelines? First, bring your existing OpenTelemetry instrumented application and observability vendor. Tracetest works natively with the major observability vendors such as Datadog, Honeycomb, Jaeger, Tempo or Dynatrace. Second, take your existing tests, such as Postman, k6, Artillery, Cypress or Playwright, and use Tracetest with them.
Available as a SaaS platform or on premises, Tracetest leverages the investment your organization has made in observability to allow a proactive use across the entire engineering team, reducing both the time to fix tests and the capability of these tests.
YOUTUBE.COM/THENEWSTACK
Tech moves fast, don’t miss an episode. Subscribe to our YouTubechannel to stream all our podcasts, interviews, demos, and more.