
包阅导读总结
1. 关键词:性能调试、核心网页指标、工具类别、归因与调试、真实用户数据
2. 总结:本文介绍了用于衡量和调试性能的工具类别,包括实验室工具和现场工具,并重点阐述了如何为核心网页指标收集现场调试信息,如 CLS、LCP、INP 等,还提到了使用 web-vitals JavaScript 库获取相关信息。
3. 主要内容:
– 性能调试介绍
– 学习如何利用调试信息归因性能数据,以识别和解决真实用户问题。
– 谷歌提供实验室和现场两类性能调试工具。
– 核心网页指标的调试
– 累积布局偏移(CLS)
– 现场收集 CLS 调试信息重要,可通过相关接口观察页面布局偏移及元素。
– 示例代码展示如何记录和获取最大偏移源元素。
– 最大内容绘制(LCP)
– 调试需确定特定页面加载的 LCP 候选元素。
– 可使用相关 API 确定,注意候选元素可能因用户而异。
– 交互到下一次绘制(INP)
– 需记录交互元素、类型和时间。
– web-vitals JavaScript 库
– 版本 3 包含归因构建,可获取相关调试信息。
思维导图: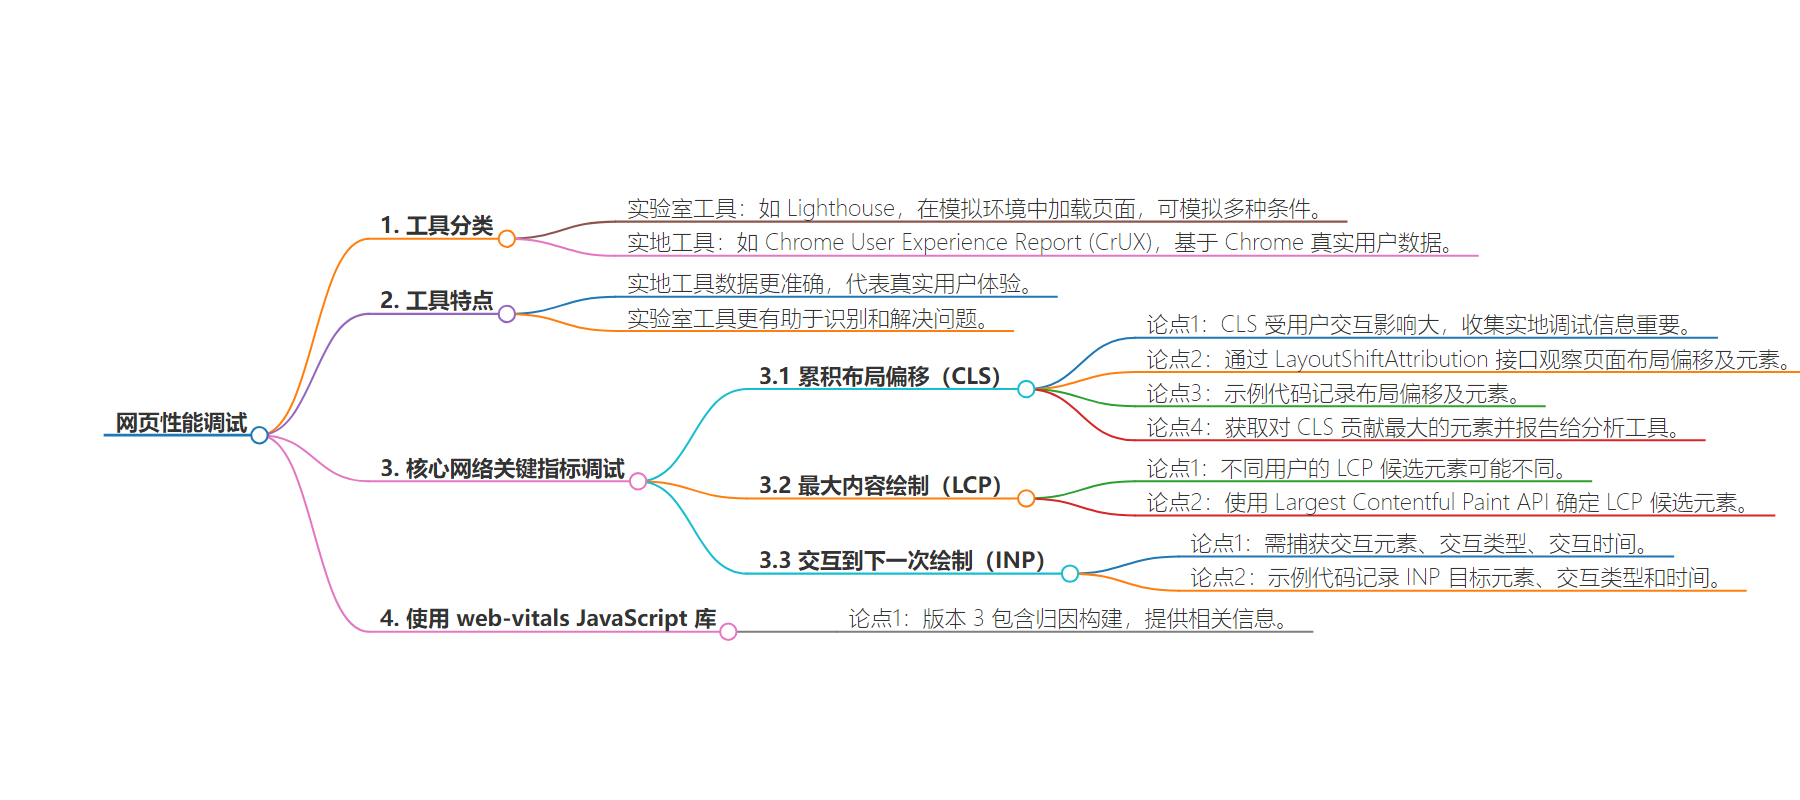
文章地址:https://web.dev/articles/debug-performance-in-the-field?hl=en
文章来源:web.dev
作者:Web Dev Articles
发布时间:2024/6/19 0:00
语言:英文
总字数:2192字
预计阅读时间:9分钟
评分:86分
标签:性能,调试,网页核心体验,CrUX,Lighthouse
以下为原文内容
本内容来源于用户推荐转载,旨在分享知识与观点,如有侵权请联系删除 联系邮箱 media@ilingban.com
Learn how to attribute your performance data with debug informationto help you identify and fix real-user issues with analytics
Google provides two categories of tools to measure and debug performance:
- Lab tools: Tools such as Lighthouse, where your page is loaded in asimulated environment that can mimic various conditions (for example, a slownetwork and a low-end mobile device).
- Field tools: Tools such as Chrome User ExperienceReport(CrUX), which is based on aggregate, real-user data from Chrome. (Note that thefield data reported by tools such as PageSpeedInsights and SearchConsole is sourced fromCrUX data.)
While field tools offer more accurate data—data which actually represents whatreal users experience—lab tools are often better at helping you identify and fixissues.
CrUX data is more representative of your page’s real performance, but knowingyour CrUX scores is unlikely to help you figure out how to improve yourperformance.
Lighthouse, on the other hand, will identify issues and make specificsuggestions for how to improve. However, Lighthouse will only make suggestionsfor performance issues it discovers at page load time. It does not detect issuesthat only manifest as a result of user interaction such as scrolling or clickingbuttons on the page.
This raises an important question: how can you capture debug information forCore Web Vitals or other performance metrics from real users in the field?
This post will explain in detail what APIs you can use to collect additionaldebugging information for each of the current Core Web Vitals metrics and giveyou ideas for how to capture this data in your existing analytics tool.
APIs for attribution and debugging
Cumulative Layout Shift (CLS)
Of all the Core Web Vitals metrics, CLS is perhaps the one for whichcollecting debug information in the field is the most important. CLS is measuredthroughout the entire lifespan of the page, so the way a user interacts with thepage—how far they scroll, what they click, and so on—can have a significantimpact on whether there are layout shifts and which elements are shifting.
Consider the following report from PageSpeed Insights:
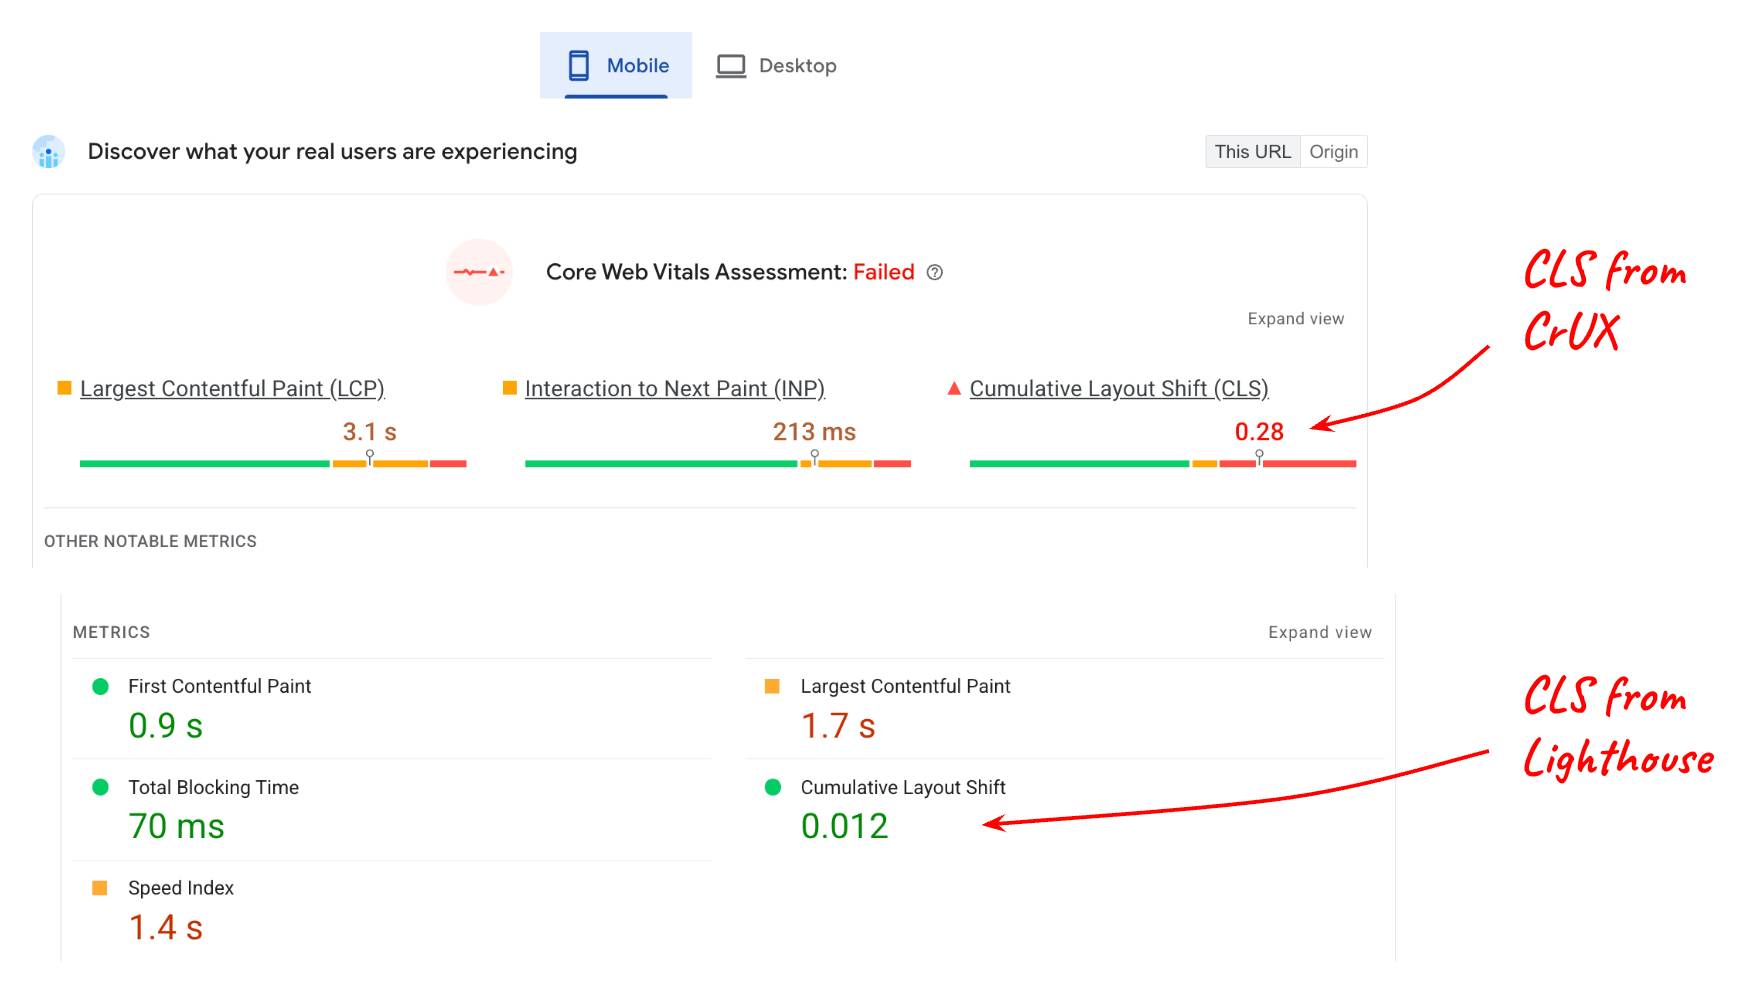
The value reported for CLS from the lab (Lighthouse) compared to the CLS fromthe field (CrUX data) are quite different, and this makes sense if you considerthat the page may have a lot of interactive content thatis not being used when tested in Lighthouse.
But even if you understand that user interaction affects field data, you stillneed to know what elements on the page are shifting to result in a score of 0.28at the 75th percentile. The LayoutShiftAttributioninterface makes that possible.
Get layout shift attribution
The LayoutShiftAttributioninterface is exposed on each layout-shift entry that Layout InstabilityAPI emits.
For a detailed explanation of both of these interfaces, see Debug layoutshifts. For the purposes ofthis post, the main thing you need to know is that, as a developer, you are ableto observe every layout shift that happens on the page as well as what elementsare shifting.
Here’s some example code that logs each layout shift as well as the elementsthat shifted:
new PerformanceObserver((list) => { for (const {value, startTime, sources} of list.getEntries()) { // Log the shift amount and other entry info. console.log('Layout shift:', {value, startTime}); if (sources) { for (const {node, curRect, prevRect} of sources) { // Log the elements that shifted. console.log(' Shift source:', node, {curRect, prevRect}); } } }}).observe({type: 'layout-shift', buffered: true});It’s probably not practical to measure and send data to your analytics tool forevery single layout shift that occurs; however, by monitoring all shifts, youcan keep track of the worst shifts and just report information about those.
The goal isn’t to identify and fix every single layout shift that occurs forevery user; the goal is to identify the shifts that affect the largest number ofusers and thus contribute the most to your page’s CLS at the 75th percentile.
Also, you don’t need to compute the largest source element every time there’s ashift, you only need to do so when you’re ready to send the CLS value to youranalytics tool.
The following code takes a list of layout-shift entries that have contributedto CLS and returns the largest source element from the largest shift:
function getCLSDebugTarget(entries) { const largestEntry = entries.reduce((a, b) => { return a && a.value > b.value ? a : b; }); if (largestEntry && largestEntry.sources && largestEntry.sources.length) { const largestSource = largestEntry.sources.reduce((a, b) => { return a.node && a.previousRect.width * a.previousRect.height > b.previousRect.width * b.previousRect.height ? a : b; }); if (largestSource) { return largestSource.node; } }}Once you’ve identified the largest element contributing to the largest shift,you can report that to your analytics tool.
The element contributing the most to CLS for a given page will likely vary fromuser to user, but if you aggregate those elements across all users, you’ll beable to generate a list of shifting elements affecting the most number of users.
After you’ve identified and fixed the root cause of the shifts for thoseelements, your analytics code will start reporting smaller shifts as the “worst”shifts for your pages. Eventually, all reported shifts will be small enough thatyour pages are well within the “good” threshold of0.1!
Some other metadata that may be useful to capture along with the largest shiftsource element is:
- The time of the largest shift
- The URL path at the time of the largest shift (for sites that dynamicallyupdate the URL, such as Single Page Applications).
Largest Contentful Paint (LCP)
To debug LCP in the field, the primary information you need is which particularelement was the largest element (the LCP candidate element) for that particularpage load.
Note that it’s entirely possible—in fact, it’s quite common—that the LCPcandidate element will be different from user to user, even for the exact samepage.
This can happen for several reasons:
- User devices have different screen resolutions, which results in differentpage layouts and thus different elements being visible within the viewport.
- Users don’t always load pages scrolled to the very top. Oftentimes links willcontain fragment identifiers or eventext fragments, which means it’s possiblefor your pages to be loaded and displayed at any scroll position on the page.
- Content may be personalized for the current user, so the LCP candidate elementcould vary wildly from user to user.
This means you cannot make assumptions about which element or set of elementswill be the most common LCP candidate element for a particular page. You have tomeasure it based on real-user behavior.
Identify the LCP candidate element
To determine the LCP candidate element in JavaScript you can use the LargestContentful Paint API, thesame API you use to determine the LCP time value.
When observing largest-contentful-paint entries, you can determine thecurrent LCP candidate element by looking at the element property of the last entry:
new PerformanceObserver((list) => { const entries = list.getEntries(); const lastEntry = entries[entries.length - 1]; console.log('LCP element:', lastEntry.element);}).observe({type: 'largest-contentful-paint', buffered: true});Once you know the LCP candidate element, you can send it to your analytics toolalong with the metric value. As with CLS, this will help you identify whichelements are most important to optimize first.
In addition to the LCP candidate element, it may also be useful to measure theLCP sub-part times, which can be usefulin determining what specific optimization steps are relevant for your site.
Interaction to Next Paint (INP)
The most important bits of information to capture in the field for INP are:
- What element was interacted with
- Why type of interaction it was
- When that interaction took place
A major cause of slow interactions is a blocked main thread, which canbe common while JavaScript is loading. Knowing whether most slow interactionsoccur during page load is helpful in determining what needs to be done to fixthe problem.
The INP metric considers the full latency of aninteraction—including the time it takes to run any registered event listeners aswell as the time it takes to paint the next frame after all events listenershave run. This means that for INP it’s really useful to know which targetelements tend to result in slow interactions, and what types of interactionsthose are.
The following code logs the target element and time of the INP entry.
function logINPDebugInfo(inpEntry) { console.log('INP target element:', inpEntry.target); console.log('INP interaction type:', inpEntry.name); console.log('INP time:', inpEntry.startTime);}Note that this code doesn’t show how to determine which event entry is the INPentry, as that logic is more involved. However, the following section explainshow to get this information using theweb-vitals JavaScript library.
Usage with the web-vitals JavaScript library
The previous sections offer some general suggestions and code examples to capturedebug info to include in the data you send to your analytics tool.
Since version 3, the web-vitalsJavaScript library includes an attributionbuild thatsurfaces all of this information, and a few additionalsignals as well.
The following code example shows how you could set an additional eventparameter (or customdimension) containing adebug string useful for helping to identify the root cause of performanceissues.
import {onCLS, onINP, onLCP} from 'web-vitals/attribution';function sendToGoogleAnalytics({name, value, id, attribution}) { const eventParams = { metric_value: value, metric_id: id, } switch (name) { case 'CLS': eventParams.debug_target = attribution.largestShiftTarget; break; case 'LCP': eventParams.debug_target = attribution.element; break; case 'INP': eventParams.debug_target = attribution.interactionTarget; break; } // Assumes the global `gtag()` function exists, see: // https://developers.google.com/analytics/devguides/collection/ga4 gtag('event', name, eventParams);}onCLS(sendToGoogleAnalytics);onLCP(sendToGoogleAnalytics);onFID(sendToGoogleAnalytics);onINP(sendToGoogleAnalytics);This code is specific to Google Analytics, but the general idea should translateto other analytics tools as well.
This code also just shows how to report on a single debug signal, but it isuseful to be able to collect and report on multiple different signals permetric.
For example, to debug INP you might want to collect the element beinginteracted with, the interaction type, the time, the loadState, the interactionphases and more (such as Long Animation Frame data).
The web-vitals attribution build exposes additional attribution information,as shown in the following example for INP:
import {onCLS, onINP, onLCP} from 'web-vitals/attribution';function sendToGoogleAnalytics({name, value, id, attribution}) { const eventParams = { metric_value: value, metric_id: id, } switch (name) { case 'INP': eventParams.debug_target = attribution.interactionTarget; eventParams.debug_type = attribution.interactionType; eventParams.debug_time = attribution.interactionTime; eventParams.debug_load_state = attribution.loadState; eventParams.debug_interaction_delay = Math.round(attribution.inputDelay); eventParams.debug_processing_duration = Math.round(attribution.processingDuration); eventParams.debug_presentation_delay = Math.round(attribution.presentationDelay); break; // Additional metric logic... } // Assumes the global `gtag()` function exists, see: // https://developers.google.com/analytics/devguides/collection/ga4 gtag('event', name, eventParams);}onCLS(sendToGoogleAnalytics);onLCP(sendToGoogleAnalytics);onFID(sendToGoogleAnalytics);onINP(sendToGoogleAnalytics);Refer to the web-vitals attributiondocumentation for thecomplete list of debug signals exposed.
Report and visualize the data
Once you’ve started collecting debug information along with the metric values,the next step is aggregating the data across all your users to start looking forpatterns and trends.
As mentioned previously, you don’t necessarily need to address every single issueyour users are encountering, you want to address—especially at first—the issuesthat are affecting the largest number of users, which should also be the issuesthat have the largest negative impact on your Core Web Vitals scores.
For GA4 see the dedicated article on how to query and visualize the data usingBigQuery.
Summary
Hopefully this post has helped outline the specific ways you can use theexisting performance APIs and the web-vitals library to get debug informationto help diagnose performance based on real users visits in the field. While thisguide is focused on the Core Web Vitals, the concepts also apply to debuggingany performance metric that’s measurable in JavaScript.
If you’re just getting started measuring performance, and you’re already aGoogle Analytics user, the Web Vitals Report tool may be a good place to startbecause it already supports reporting debug information for the Core WebVitals metrics.
If you’re an analytics vendor and you’re looking to improve your products andprovide more debugging information to your users, consider some of thetechniques described here but don’t limit yourself to just the ideas presentedhere. This post is intended to be generally applicable to all analytics tools;however, individual analytics tools likely can (and should) capture and reporteven more debug information.
Lastly, if you feel there are gaps in your ability to debug these metrics due tomissing features or information in the APIs themselves send your feedback toweb-vitals-feedback@googlegroups.com.