包阅导读总结
1. 关键词:Grafana、Embrace、Mobile Data、Observability、OpenTelemetry
2. 总结:Grafana 选择加深与 Embrace 的集成以提升移动应用可观测性能力,新集成能收集前端遥测数据,用户可跨数据查询构建系统视图,还基于 OpenTelemetry 解决了移动和后端基础设施数据观测的差距,这在移动应用重要性日增的当下具有意义。
3. 主要内容:
– Grafana 加深与 Embrace 集成以增强移动应用观测能力
– 此前 Embrace 作为插件,新集成提供更多功能
– 集成后的优势
– 收集完整前端遥测数据,直接在 Grafana Cloud 分析
– 延伸到终端用户,记录分析设备错误消息
– 超越插件的意义
– 用户可跨所有遥测数据查询,构建系统视图
– 满足客户对移动应用观测及改进 SLO 和用户体验的需求
– Embrace 特点
– 本身非开源,SDK 基于 OpenTelemetry
– 考虑移动遥测数据的特殊情况
– 实时数据推送的作用
– 提供应用各方面实时的可访问性和可见性
– 帮助确定错误范围和分析问题
– 与 OpenTelemetry 的连接
– 解决移动和后端基础设施观测数据的差距
– 重要性
– 适应移动应用重要性增加的趋势,与其他观测平台竞争
思维导图:
文章地址:https://thenewstack.io/grafana-relies-on-embrace-to-pull-mobile-data/
文章来源:thenewstack.io
作者:B. Cameron Gain
发布时间:2024/6/26 15:34
语言:英文
总字数:878字
预计阅读时间:4分钟
评分:84分
标签:Grafana,Embrace,移动应用程序可观察性,遥测数据,OpenTelemetry
以下为原文内容
本内容来源于用户推荐转载,旨在分享知识与观点,如有侵权请联系删除 联系邮箱 media@ilingban.com
Grafana Labs has opted to deepen its integration with Embraceas a way to enhance its capabilities in mobile application observability. Previously, Embrace was available as a Grafana plugin, enabling real-time data visualization of data stored in Embrace and analysis for mobile apps. However, this new integration offers much more.
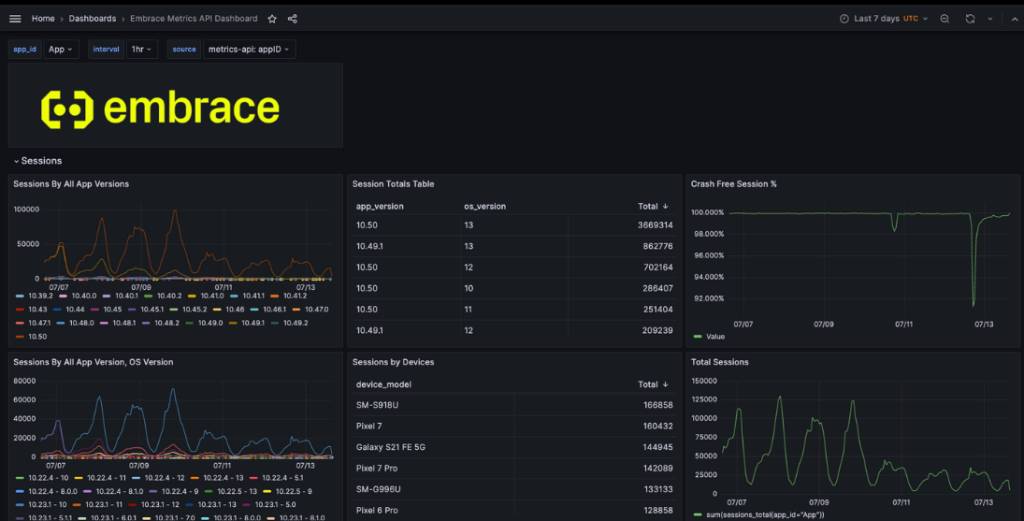
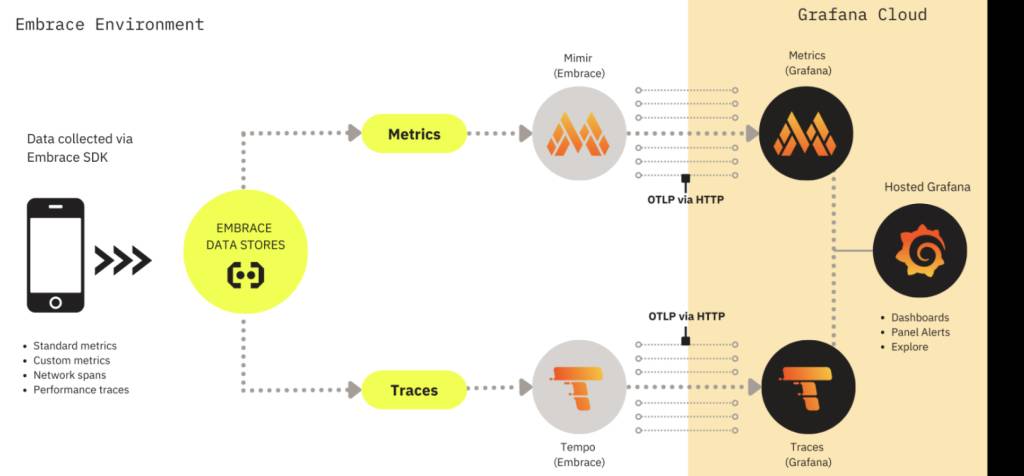
With the integration of Embrace, users can gather complete frontend telemetry data from mobile apps. This enables the analysis of mobile app application performance data directly in Grafana Cloud by ingesting metrics, traces and (in the future) logs directly from Embrace. Its reach extends to the end user, logging and analyzing error messages on devices, whether iPhones, Android phones or others.

Going beyond its limitation as a plugin means Embrace and Grafana Cloud customers can now write queries “across all of their telemetry data, from infrastructure to the mobile application, and build a whole system view into their SLOs [service-level objectives] and user experiences,” Logan Smith, director of business development, told The New Stack.
Grafana customers had been asking for ways to instrument and observe their mobile applications to provide a complete view of their infrastructure and apps, and then measure and improve SLOs and user experiences, Smith said. Embrace builds its own distribution for OpenTelemetry (OTel), so teams have a variety of implementation paths, but when using it with Grafana Cloud they get pre-built experiences to help mobile engineers participate in an organization’s observability practice, Smith said.
“Grafana works for all mobile application observability. With Embrace, we provide a happy path of deeper integration and shorter time to value,” Smith said.

Embrace itself is not open source per se — it’s a closed-source platform that builds open source instrumentation. Its SDK used to instrument the app is open source software and based on OpenTelemetry, Smith explained. Mobile telemetry data has its own set of considerations — intermittent connectivity to the device, type of usage, etc. — and it needs to be handled differently, Smith said.
“This just underscores the importance of our ‘Big Tent’ philosophy and why we prioritize interoperability within the wider ecosystem and with tools like Embrace,” Smith said. “We believe that organizations should own their own observability strategy, choose their own tools and have the freedom to bring all their data together in one unified view in Grafana.”
With Embrace, data now pushes to your Grafana panel for debugging. This capacity offers both accessibility and visibility for individual actions, error messages, timing, timeouts and other aspects of applications in real time. For example, it is possible to home in on incidents as they occur and correlate possible connections between them. Each incident can be pinpointed and analyzed individually, along with the entire usage timeline of the application.
In the event of a crash, it can be quickly determined whether particular errors are widespread or limited to specific use cases in real time. By using the capacity to pinpoint and analyze specific errors, it’s possible to focus on particular crashes or errors and see how they might correlate with certain patterns, aiding in the analysis of larger problems.
The OTel Connection
This capability is built into the application, with data pushed through OpenTelemetry via the Grafana panel. A key challenge the Embrace and Grafana Cloud offering helps to resolve with OpenTelemetry is the gap between mobile application and backend infrastructure observability data, Smith noted, which generally makes it harder and more time consuming to pinpoint and resolve issues.
According to the Grafana 2024 Observability Survey, 85% of respondents are investing in OpenTelemetry, and its popularity extends to both application and infrastructure observability, he said.
“This means OTel, with its open standards and vendor neutrality, is the clear choice for bridging that gap,” Smith noted. “Because Embrace’s SDKs rely on OpenTelemetry to ship telemetry data to Grafana Cloud and Grafana makes interoperability with OTel easy, this combination provides a powerful observability solution without fear of vendor lock-in.”
Why It’s Important
Mobile observability is certainly critical as mobile applications continue to play a key part in distributing computing and networking. To that end, Grafana, with Embrace in this case, has very good reasons to adapt its solutions for telemetry data pull along with other leading observability players including Splunk, Datadog, Honeycomb and others.
Real-user monitoring is a good example. As Gartner describes it, real-user monitoring measures the experience of application users. JavaScript is automatically injected into web applications to collect data, Gartner analysts Padraig Byrne, Matt Crossley, Martin Caren and Mrudula Bangera co-wrote in their report, “Key Considerations When Choosing APM and Observability Platforms.”
Alternatively, plugins can be deployed when HTML is not accessible (such as in the case of SaaS applications), they write.
“Session recording and replay shows what the user experienced during an application session, which the IT monitoring teams can correlate with other application performance metrics for root cause analysis (RCA),” the analysts write. They say the target metric communicates:
- Basic: JavaScript injection, collection of user data such as applicationresponse time, latency, errors, geolocation, browser and versions.
- Advanced: Support for mobile and non-browser-based applications, visualizations of the end-client journey, including analysis of business metricssuch as client spend.
YOUTUBE.COM/THENEWSTACK
Tech moves fast, don’t miss an episode. Subscribe to our YouTubechannel to stream all our podcasts, interviews, demos, and more.
