包阅导读总结
1.
关键词:Synthetic Monitoring、OpenTelemetry、Visibility、Testability、Distributed Tracing
2.
总结:本文探讨了将 OpenTelemetry 用于合成监测的优势,指出现有合成监测工具的局限性,介绍了 OpenTelemetry 在提高可见性和可测试性方面的作用及带来的众多好处,还提及了 Tracetest 这一利用 OpenTelemetry 的现代测试解决方案。
3.
主要内容:
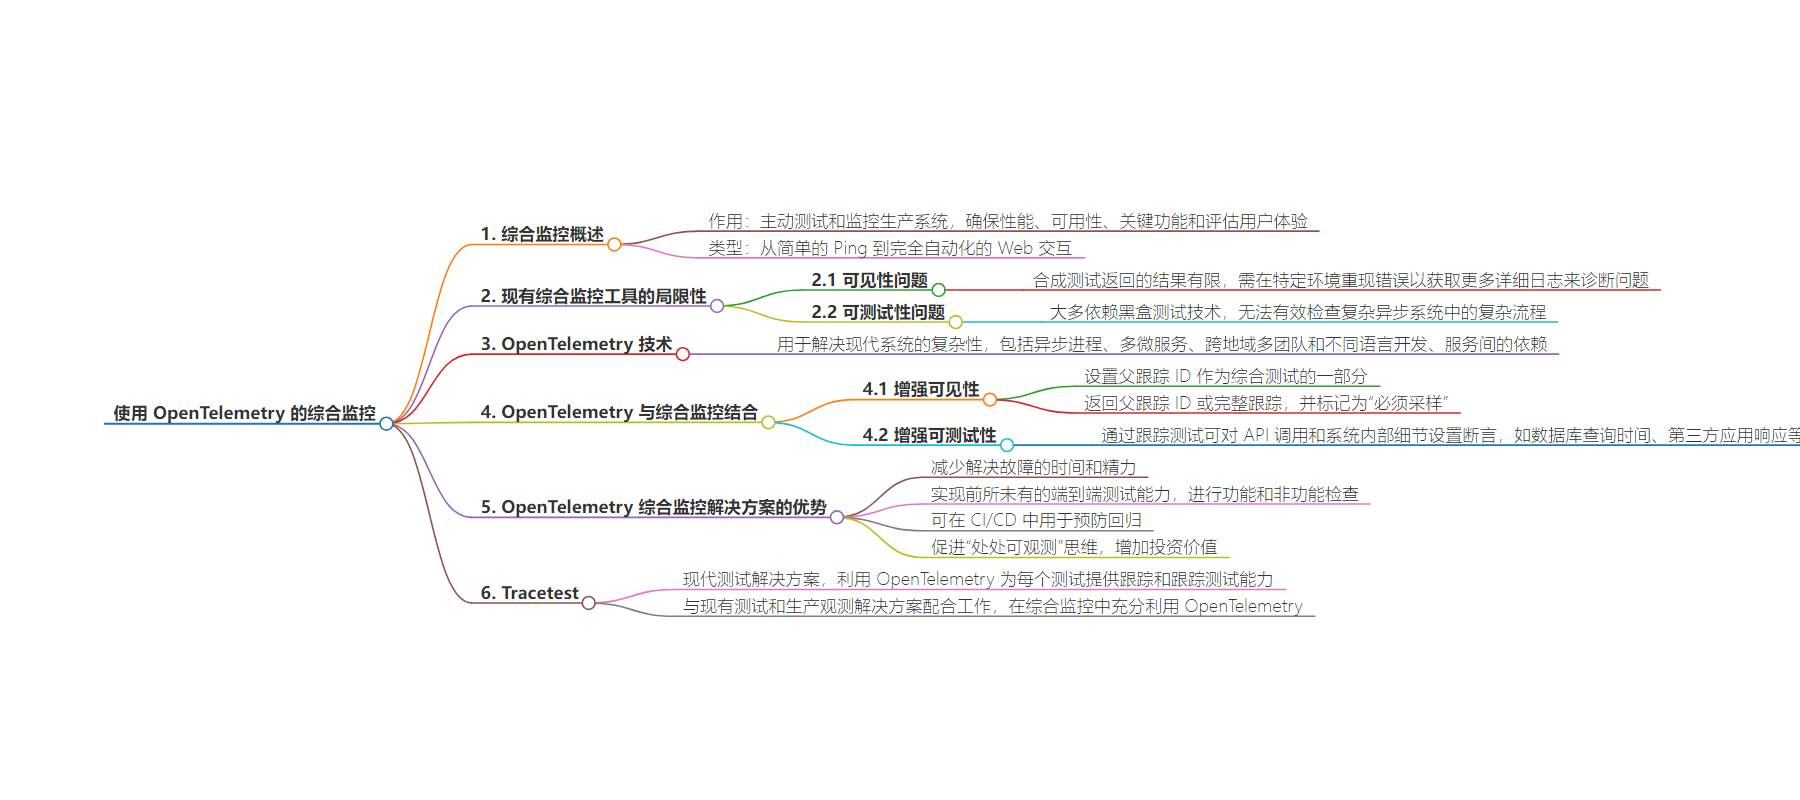
– Synthetic Monitoring 简介:用于主动测试和监控生产系统,包括多种类型的监视器。
– 现有工具的局限性:结果返回信息少,依赖黑盒测试技术,存在可见性和可测试性问题。
– OpenTelemetry 的作用:帮助快速诊断和解决生产故障,应对现代系统的复杂性。
– 增强合成监测:通过设置父跟踪 ID 等提高可见性,通过基于跟踪的测试增加可测试性。
– 带来的好处:减少解决故障的时间和精力,实现前所未有的端到端测试能力,可用于 CI/CD 预防回归,促进“处处可观测性”思维。
– Tracetest 解决方案:利用 OpenTelemetry 为每个测试提供跟踪和基于跟踪的测试能力,能与现有测试和生产观测解决方案协同工作。
思维导图:
文章地址:https://thenewstack.io/synthetic-monitoring-with-opentelemetry/
文章来源:thenewstack.io
作者:Ken Hamric
发布时间:2024/8/1 19:50
语言:英文
总字数:932字
预计阅读时间:4分钟
评分:88分
标签:合成监控,OpenTelemetry,分布式跟踪,可观察性,微服务
以下为原文内容
本内容来源于用户推荐转载,旨在分享知识与观点,如有侵权请联系删除 联系邮箱 media@ilingban.com
Synthetic monitoring is used to proactively test and monitor production systems, ensuring performance, availability, key functionality and assessing user experience. There are several types of monitors, ranging from simple pings to fully automated web interactions.
Modern engineering teams are now using OpenTelemetry and distributed tracing for production monitoring and troubleshooting, but mostly in a manual, reactive manner. Are there advantages to using OpenTelemetry in proactive synthetic monitoring tests?
Limitations With Existing Synthetic Monitoring Tools
There are two major limitations in most synthetic monitoring tools that better visibility can eliminate:
- Results returned from a synthetic test are minimal. This requires an engineer to reproduce the error in an environment where they can capture more detailed logging information to begin diagnosing the problem.
- Most synthetic tools rely on black box test techniques, which fail to properly check the complex flows present in today’s complex, asynchronous systems.
Let’s label these as a problem of visibility and testability. How can we do better?
The Enabling Technology — OpenTelemetry
Modern DevOps and site reliability engineering (SRE) teams use observability, specifically OpenTelemetry, to quickly diagnose and troubleshoot production failures. Distributed tracing, in particular, was built to address the complexity of today’s modern systems, including:
- Asynchronous processes, with message-based architectures such as Kafka.
- Systems divided into multiple microservices, with more reliance on third-party services.
- Multiple teams, geographically dispersed, writing code in different languages.
- Individual services are being tested separately but are highly dependent on proper operation across boundaries when fully connected.
These complexities make it challenging for an engineer to fully understand what is happening across the system when a process or API call fails. With distributed tracing, however, engineers can see the full details of transactions across various microservices. This visibility helps manage these complex systems, offering needed insights into the microservices and the entire system’s operation.
Use OpenTelemetry With Synthetic Monitoring
OpenTelemetry can enhance synthetic monitoring by increasing both visibility and testability.
Increasing Visibility in Synthetic Monitoring With OpenTelemetry
Visibility is fairly straightforward. If you have a synthetic monitor running in production and it fails, what engineer would not want to see the distributed trace from that failed transaction?
You might think, “No problem, I will check my production observability solution and get the trace.” Unfortunately, most high-volume production systems rely on sampling, so the odds of having the trace from this particular execution are small.
Secondly, even with sampling set at 100% of traces, you still need to correlate the one synthetic monitoring transaction with the thousands of transactions occurring in that time window. This is not an easy, quick or reliable task.
To use the visibility enabled by OpenTelemetry, you need a synthetic monitoring system that:
- Sets the parent trace ID as part of running a synthetic test so you know which trace belongs to this run.
- Returns this parent trace ID, or preferably the full trace, as part of each test result.
- Marks each execution as “must be sampled” by setting the sampled flag in the trace flags.
The synthetic monitoring solution needs to be built with OpenTelemetry in mind.
Increasing Testability in Synthetic Monitoring With OpenTelemetry

Using observability to increase testability is just as critical. Almost all API-based synthetic tests are limited to running black-box tests, unable to set assertions based on any internal details of the system under test. Browser-based synthetic tests, while having more visibility into the browser’s internals, are also completely blind to the backend system.
Fortunately, OpenTelemetry offers a solution through a technique called trace-based testing. This method allows you to place assertions not only on the results of an API call but also on any system exposed in the trace. You can add a wide range of additional validations to any synthetic test, such as:
- All database queries should happen in less than 100ms.
- A third-party app should return a particular response, in a particular format, in a particular length of time.
- Asynchronous processes, which the API call may not even block for, should complete successfully.
- A critical process must pull a message from a Kafka queue in a particular time frame.
- All gRPC calls in the trace should return a status code 0, which signifies success.
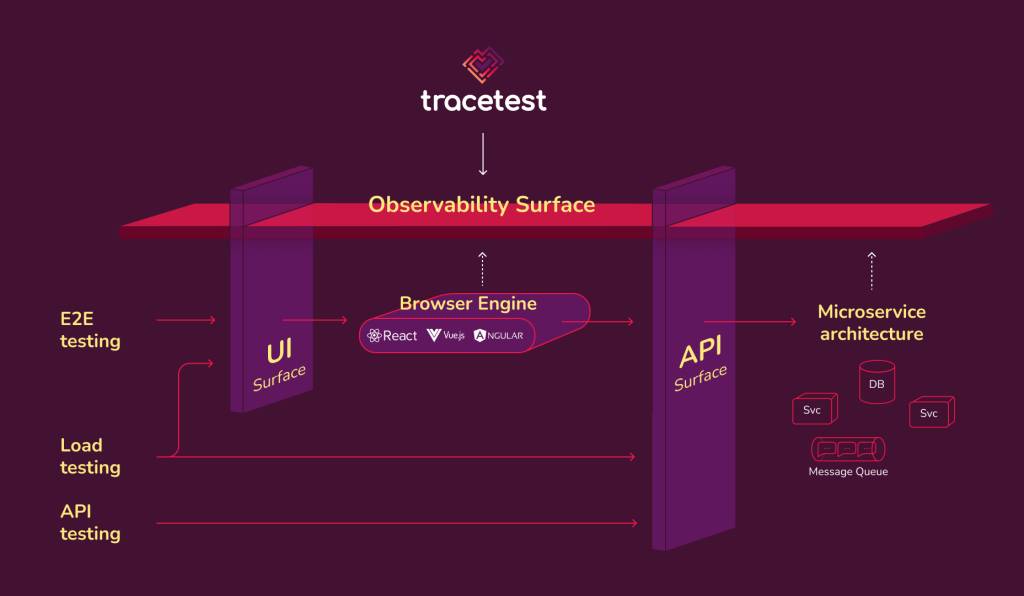
Trace-based testing works by using the observability surface exposed by OpenTelemetry. This additional response data can be asserted against as part of a synthetic API or browser-based test.

Benefits of an OpenTelemetry-Enabled Synthetic Monitoring Solution
Synthetic monitoring solutions built with a deep understanding of OpenTelemetry improve both visibility and testability. The benefits to the organization leveraging this power are numerous:
- Having a trace with every test decreases time and effort to resolve failures.
- The ability to use trace-based testing to verify entire system flows allows unprecedented end-to-end test capability, enabling both functional and nonfunctional checks on the frontend and the backend.
- Trace-based tests created for synthetic monitoring can be used in CI/CD to proactively prevent regressions.
- Using OpenTelemetry as part of your synthetic monitoring promotes an “observability everywhere” mindset and increases the use and value derived from your investment in observability.
About Tracetest
Tracetest is a modern testing solution which harnesses OpenTelemetry to provide a trace for every test and trace-based testing capability. Tracetest works with your existing tests, such as Playwright, Cypress, Postman, or k6 and your existing production observability solution, such as Tempo, Honeycomb, Datadog or Dynatrace, to proactively leverage distributed tracing data in your CI/CD flows. Now capable of running synthetic monitors triggered by your Playwright tests, Tracetest fully leverages OpenTelemetry as part of synthetic monitoring.
YOUTUBE.COM/THENEWSTACK
Tech moves fast, don’t miss an episode. Subscribe to our YouTubechannel to stream all our podcasts, interviews, demos, and more.
