
包阅导读总结
1. 关键词:PostgreSQL、AlloyDB、Logs Explorer、Custom Metrics、Database Monitoring
2. 总结:本文介绍了在 Google Cloud 中运行 PostgreSQL 兼容工作负载的选项,强调了监测数据库性能的重要性,特别是通过其错误日志,还提到 Logs Explorer 工具可用于查看和分析日志及创建自定义指标,并简述了创建新指标的步骤。
3. 主要内容:
– Google Cloud 中运行 PostgreSQL 兼容工作负载的选择,如 Cloud SQL for PostgreSQL、AlloyDB 等。
– 生产环境中需监测数据库性能的不同方面,如锁定状况、特定错误数量等,监测错误日志对数据库健康很重要。
– Logs Explorer 是可查看和分析 Cloud SQL for PostgreSQL 或 AlloyDB 实例日志的工具,还能创建自定义指标。
– 可利用 postgres.log 中的任何条目创建新指标并指定要跟踪或提醒的条件/错误。
– 给出使用 Log Explorer 创建新自定义指标以增强监测的步骤。
– 首先要确定想监测的错误类型,示例中创建了只有一列的表。
思维导图: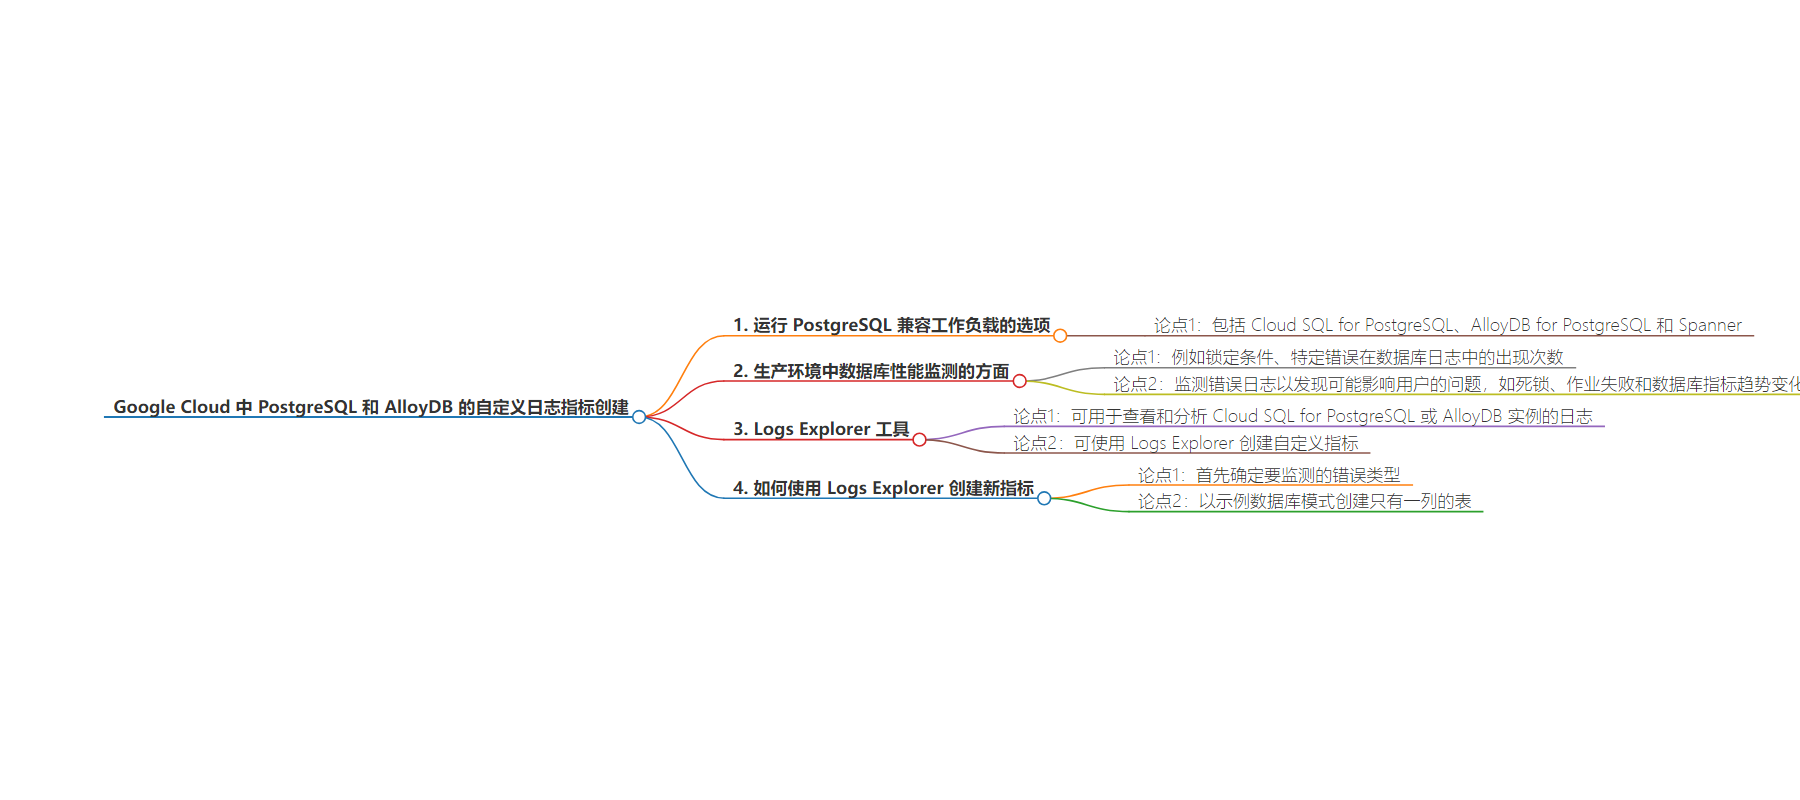
文章来源:cloud.google.com
作者:Svitlana Gavrylova,Indu Akkineni
发布时间:2024/6/28 0:00
语言:英文
总字数:1256字
预计阅读时间:6分钟
评分:83分
标签:数据库,管理工具,开发者与实践者
以下为原文内容
本内容来源于用户推荐转载,旨在分享知识与观点,如有侵权请联系删除 联系邮箱 media@ilingban.com
Google Cloud has several options for running PostgreSQL-compatible workloads including Cloud SQL for PostgreSQL, AlloyDB for PostgreSQL, and Spanner. To make sure that your databases are running optimally in a production environment, you need to monitor different aspects of their performance, for example, locking conditions, the number of appearances of particular errors in the database log. Additionally, a great way to take better care of your database health is by monitoring its error log for issues that may be affecting your users, such as deadlocks, job failures, and changes in database metric trends.
Logs Explorer is a Google Cloud tool that allows you to view and analyze logs from your Cloud SQL for PostgreSQL or AlloyDB instances. You can also use Logs Explorer to create custom metrics. In this blog, we present a couple of examples on how to do just that. Essentially, any entries pushed into postgres.log can be used to monitor and publish a new metric by using Logs Explorer. You can specify which exact condition/error from that log you want to track or be alerted on.
We also outline a set of steps that can guide you to use Log Explorer to create new custom metrics to enhance monitoring of your PostgreSQL database running on Cloud SQL or AlloyDB.
How to use Logs Explorer to create new metrics
First of all, let’s determine what type of errors we want to monitor.
For our example database schema, we create a table with just one column as shown below: