
包阅导读总结
1. 关键词:开源、指标仪表盘、世界卫生组织、最佳实践、协作
2. 总结:
本文介绍了为世界卫生组织构建开源指标仪表盘的项目,包括战略和挑战、工作流程与架构、开源构建的最佳实践,还提及项目后续计划和对他人参与类似项目的呼吁。
3. 主要内容:
– 项目背景
– 世界卫生组织建立开源项目办公室,GitHub 与其合作,需构建指标仪表盘衡量开源生态健康。
– 仪表盘策略与挑战
– 参考 CHAOSS 项目确定指标,面临费用、数据存储、速率限制和可维护性等挑战。
– 工作流程和架构
– 工作方式包括使用 GitHub Issues、进行配对编程和每月同步。
– 架构分生成数据的 Typescript Backend 项目和渲染 UI 的 NextJS/React 项目,通过 GitHub Actions 执行函数管道。
– 开源构建最佳实践
– 包括开放构建、为所有人配置、采用合适的社区品牌。
– 项目后续计划
– 增加数据库支持、定制数据获取和展示、迭代 UI、解锁新数据、审查项目依赖和组件。
– 对他人的呼吁
– 鼓励参与类似开源贡献项目。
思维导图: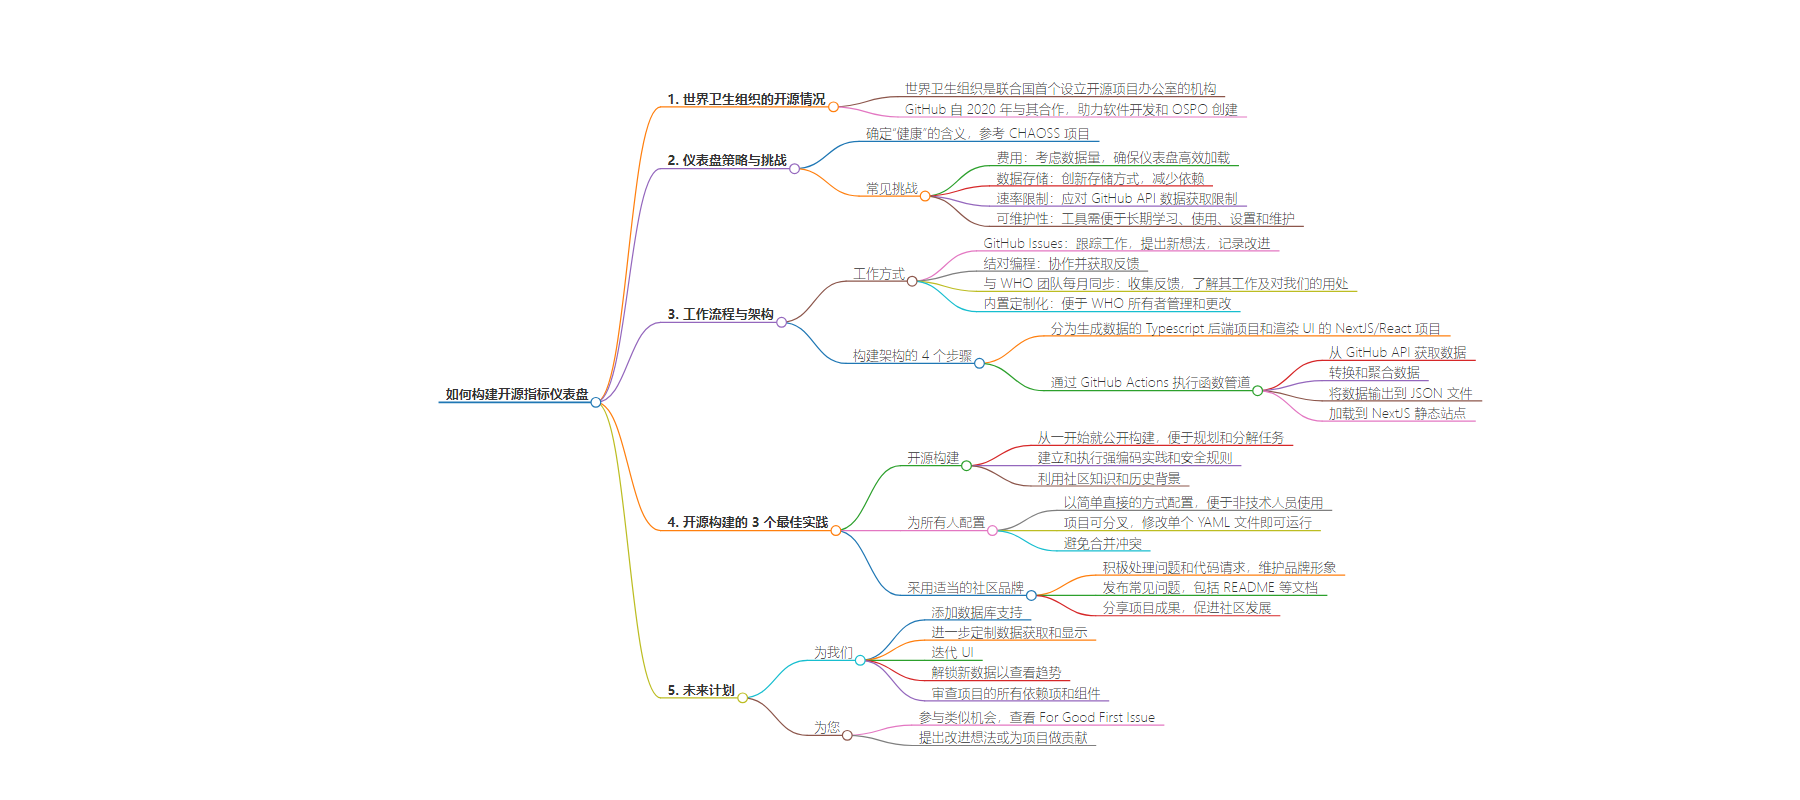
文章地址:https://github.blog/open-source/maintainers/how-to-build-an-open-source-metrics-dashboard/
文章来源:github.blog
作者:Ian Candy,Liliana Torres,Andrew Henry
发布时间:2024/9/3 16:00
语言:英文
总字数:1515字
预计阅读时间:7分钟
评分:88分
标签:开源,指标看板,GitHub,世界卫生组织,TypeScript
以下为原文内容
本内容来源于用户推荐转载,旨在分享知识与观点,如有侵权请联系删除 联系邮箱 media@ilingban.com
Open source at the World Health Organization
Did you know that the World Health Organization (WHO) was the first agency within the United Nations to establish an Open Source Programme Office (OSPO)? Though these exist in large tech companies, academic institutions, and governments, WHO’s OSPO was the first of its kind —a decision that has helped them further advance their mission through leveraging technological solutions.
GitHub has been collaborating with WHO since 2020, both in helping strengthen its inner source software development processes as well as supporting the creation of their OSPO. They have over 100 open source repositories by different groups, and one of their mandates is to make sure their open source ecosystem is safe, reliable, and well-maintained (that is, healthy). To ensure they can meet this mandate, they needed a measurable way to check what was going well, what needed improvement, and what they needed to keep an eye on.
As a part of our Social Impact Skills-Based Volunteering program, we volunteered our skills to help tackle this project: by building an open source metrics dashboard. While building this out, we not only identified some best practices that can be applied to similar projects, but also some of the best ways of collaborating on open source projects in general.
Dashboard strategy and challenges
The first step to building out the dashboard strategy was to answer the question: “What does it mean to be healthy?” We looked at the CHAOSS project from the Linux Foundation which creates metrics, metric models, and software to understand open source community health globally. We used some of their metrics as a starting point, then came up with a list of things that WHO’s OSPO was interested in and cross-referenced this with what would actually be feasible to calculate.
When building dashboards like this, there are some common challenges that you run into that you need to be able to address. They include things like:
- Expense: when developing a metric, we must consider the volume of data being utilized, especially when designing the dashboard to ensure it loads efficiently.
- Data storage: we wanted to minimize the dependencies for the project, which led us to get creative with how we store metrics once they’re calculated.
- Rate limits: every tool has its limitations to fetch data from GitHub’s API. We encountered specific rate limits while retrieving the necessary data, which required us to reevaluate how to approach getting the data and how much information we could get.
- Maintainability: for a small team, it’s important that tools are easy to learn, use, setup, and maintain in the long run.
Workflow and architecture
How we worked
Collaborating on any open source project means finding ways of working that set you up for success, including the best ways of working asynchronously, documenting expectations, and keeping everyone up to date on progress. While building out this dashboard, there were a few things that helped ensure we all stayed accountable:
- GitHub Issues helped us keep track of individual contributor’s work, raise new ideas of how to build, and make notes of future improvements.
- Pair programming made the entire process fun, enabling us to collaborate and get feedback on in-progress work.
- Monthly syncs with the WHO team were a chance for us to collect feedback as well as see what they were building and how it may be useful for us. For example, we heard from them in a feedback session that they only needed to show a subset of repos to some maintainers, so we added a topic filter to the dashboard.
- Built-in customization meant that the WHO owners would be able to easily manage and change aspects of the dashboard going forward, and it could also be used for other open source projects.

Building the architecture in 4 steps
When we started designing the architecture, we actually built it out into two separate applications. We had the Typescript Backend project that generates data, and then the NextJS/React project that renders the UI of the application. At build time, we execute a pipeline of functions via GitHub Actions. That pipeline:
- Fetches data from the public GitHub API, specifically the GraphQL API.
- Transforms and aggregates the data into the shape we want.
- Dumps the data output into a JSON file that the backend populates.
- The data is then loaded into the next JS static site build, so it will be on the frontend once the site gets built on GitHub Pages. This is the secret sauce of the project—for small or medium size organizations, the site loads quickly because all of the data is already populated on build/load time.
This is just one example of a workflow run that’s pretty simple, but sometimes small and mighty is the best option. It also meant that we were able to ship it very quickly.
3 best practices for building in open source
This project helped us identify best practices that can be applied to open source projects in general. If we had to condense this into three takeaways, they would be: build in the open, configure for everyone, and adopt proper community branding.
1. Build in the open
When it comes to open source, you want to start building it this way from the very beginning. You’ll thank yourself later on when you start planning and architecting tasks, as this will allow you to break up your project into manageable pieces. You can focus on some of the core work, while the community can pick up on some of the low hanging fruit while they’re getting acquainted with the project.
To ensure your community runs smoothly, it’s essential to establish and enforce strong coding practices and rules around security. For this project, we enforced the styles we wanted via the use of Linters and Formatters, which allowed people to onboard quickly, decrease ramp time, and increase contribution count. It’s also good practice to have rulesets on repositories—you don’t want to let just anyone push to the main branch!
Don’t forget that building in the open means that everything you’re doing is public. This means that you have access to an incredible pool of knowledge from a diverse community full of great ideas. Use them! And as people contribute, you’ll have historical context to why things were done in a certain way. The caveat to doing everything in public is that you need to make sure that you’re ok with anyone seeing the work you’ve done.
2. Configure for everyone
Once complete, this specific dashboard needed to be usable by people without a tech background, which meant we needed to configure it in a simple, straightforward way. To ensure this, we built it so that the project could be forked, where they could edit a single file in YAML and run the project from there. This single file controls the configuration for the frontend and backend in the root of the directory so that anyone can come in and fork the project, make changes, and it will work. The added benefit to building it this way was that we could make future changes upstream and they could pull them in without merge conflicts, meaning they never have to click the “Resolve conflicts” button.
Configuration is hard, and it’s important to find something that fits your project well, and will work for everyone using it.
3. Adopt proper community branding
Because open source is centered on its community, it’s important what that community thinks of both you and your project. To maintain a positive brand image, it’s important to be proactive around issues and code requests. Respond to people who have questions about your project because they’re the ones using it! Releasing issues frequently also helps to show your project is active and responsive.
Including proper community help files like a README, which tells people what the project is, how to contribute, and anything else someone new to the project would need to know. Additional documentation like a code of conduct, security policy, and support resources will also help with the health and branding of your project.
Shipping your project doesn’t mean you’re done—now it’s time to talk about it! Share the incredible work you’ve done by creating blog posts like this one, give talks at conferences, and do demos to help foster the community you worked so hard for.
What’s next for us
The great thing about building an open source metrics dashboard is that it helps us see what’s working and what future improvements we can already start planning. Next up we’re looking to:
- Add database support.
- Further customize what data we’re fetching and what we display.
- Iterate on the UI.
- Unlock new data to see trends over time.
- Review all dependencies and components of the project.
What’s next for you
This was an incredible way for us to use our skills to give back to an organization that is contributing to open source and having a positive global impact. If you’re interested in doing something similar, you can check out similar opportunities listed on For Good First Issue and help us commit to a better future!
Have ideas of other improvements or want to contribute to this project? Check it out here!
Written by
Senior Software Engineer, GitHub
Senior Data Analyst, GitHub
Senior Software Engineer, GitHub