
包阅导读总结
1. 关键词:GPT、数据分析、数据集、语言模型、商业分析
2. 总结:本文介绍了如何使用 GPT 分析大型数据集,包括处理视频会议记录、解决商业分析中的成本问题、准备数据集、应用 LlamaIndex 分析数据以及总结 GPT 在数据分析中的表现和局限性。
3. 主要内容:
– 如何使用 GPT 分析大型数据集
– 处理错过的重要视频会议:用 OpenAI Whisper 生成转录,导出为 PDF 并上传至 ChatPDF 进行总结。
– 解决商业分析成本问题:利用大型语言模型 API 替代复杂的代码编写。
– 准备数据集
– 选用 Kaggle 网站的“Investing Program Type Prediction”数据集。
– 自定义有描述性的列名,并添加客户 ID。
– 应用 LlamaIndex 分析数据
– 执行代码导入功能、添加 API 密钥、读取数据文件、构建节点和索引。
– 提出测试问题,GPT 给出的回答有一定合理性。
– 总结
– GPT 能分析大型数据集,但有局限性。
– 成功仍依赖对数据的理解和巧妙的提示。
思维导图: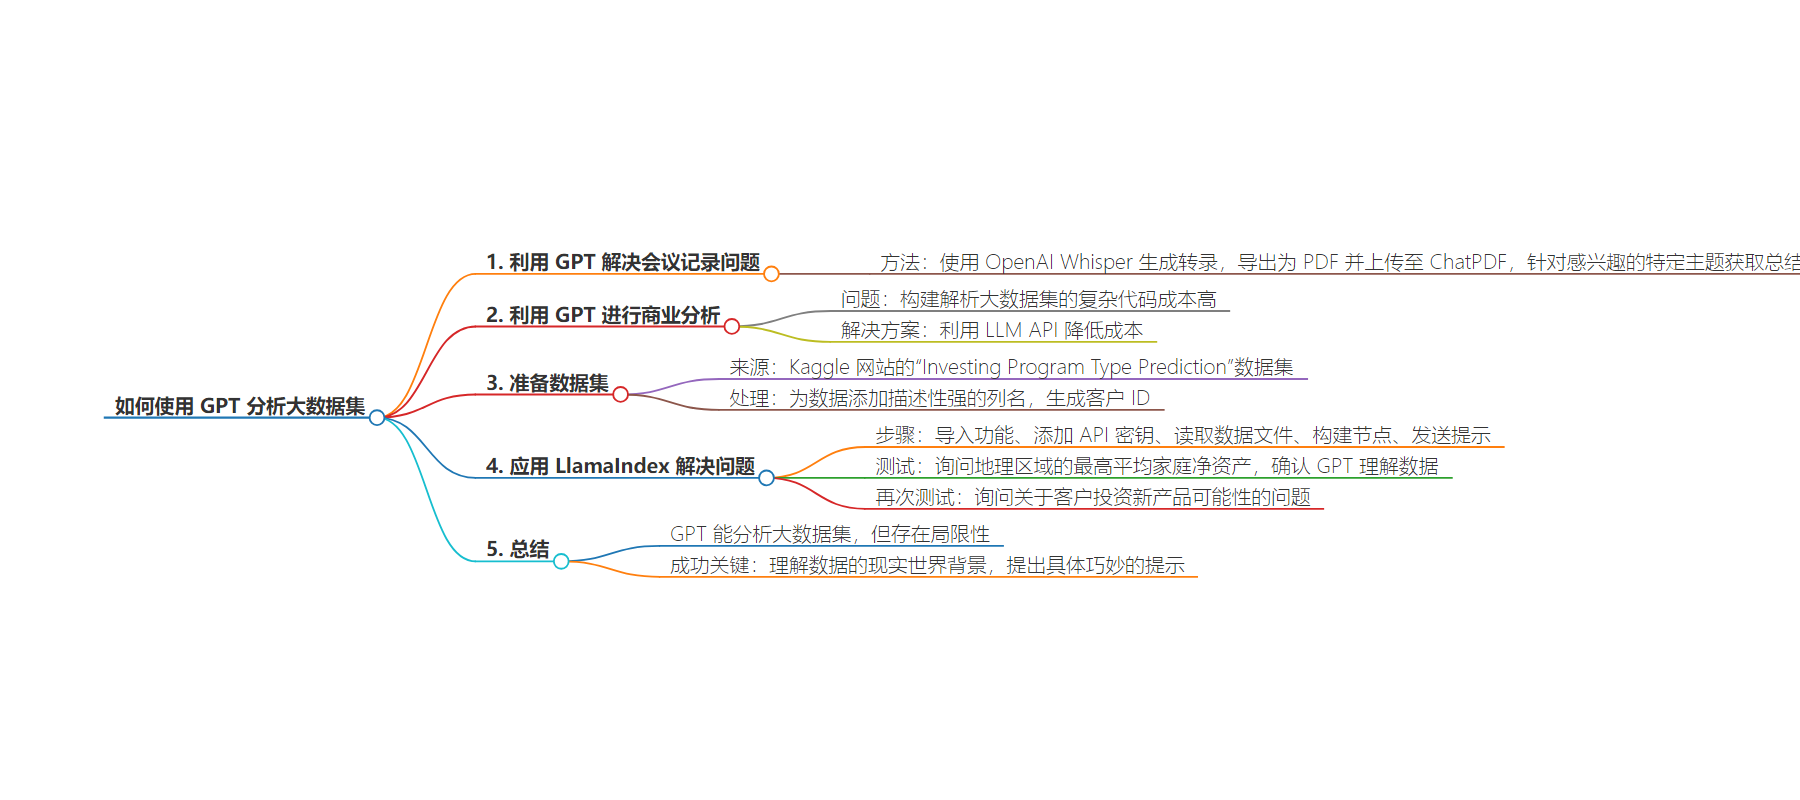
文章地址:https://www.freecodecamp.org/news/how-to-use-gpt-to-analyze-large-datasets/
文章来源:freecodecamp.org
作者:David Clinton
发布时间:2024/8/28 17:57
语言:英文
总字数:1478字
预计阅读时间:6分钟
评分:87分
标签:GPT,商业分析,数据预处理,Kaggle,LlamaIndex
以下为原文内容
本内容来源于用户推荐转载,旨在分享知识与观点,如有侵权请联系删除 联系邮箱 media@ilingban.com
Absorbing and then summarizing very large quantities of content in just a few seconds truly is a big deal. As an example, a while back I received a link to the recording of an important 90 minute business video conference that I’d missed a few hours before.
The reason I’d missed the live version was because I had no time (I was, if you must know, rushing to finish my Manning book, The Complete Obsolete Guide to Generative AI – from which this article is excerpted).
Well, a half a dozen hours later I still had no time for the video. And, inexplicably, the book was still not finished.
So here’s how I resolved the conflict the GPT way:
-
I used OpenAI Whisper to generate a transcript based on the audio from the recording
-
I exported the transcript to a PDF file
-
I uploaded the PDF to ChatPDF
-
I prompted ChatPDF for summaries connected to the specific topics that interested me
Total time to “download” the key moments from the 90 minute call: 10 minutes. That’s 10 minutes to convert a dataset made up of around 15,000 spoken words to a machine-readable format, and to then digest, analyze, and summarize it.
How to Use GPT for Business Analytics
But all that’s old news by now. The next-level level will solve the problem of business analytics.
Ok. So what is the “problem with business analytics”? It’s the hard work of building sophisticated code that parses large datasets to make them consistently machine readable (also known as “data wrangling”). It then applies complex algorithms to tease out useful insights. The figure below broadly outlines the process.
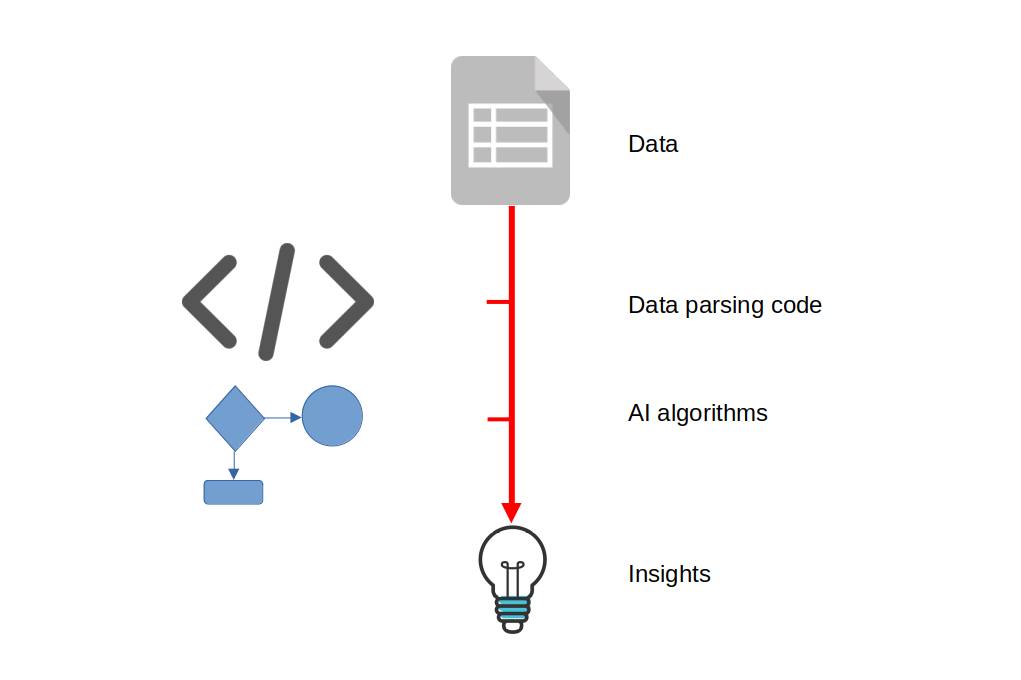
A lot of the code that fits that description is incredibly complicated, not to mention clever. Inspiring clever data engineers to write that clever code can, of course, cost organizations many, many fortunes. The “problem” then, is the cost.
So solving that problem could involve leveraging a few hundred dollars worth of large language model (LLM) API charges. Here’s how I plan to illustrate that.
I’ll need a busy spreadsheet to work with, right? The best place I know for good data is the Kaggle website.
Kaggle is an online platform for hosting datasets (and data science competitions). It’s become in important resource for data scientists, machine learning practitioners, and researchers, allowing them to showcase their skills, learn from others, and collaborate on projects. The platform offers a wide range of public and private datasets, as well as tools and features to support data exploration and modeling.
How to Prepare a Dataset
The “Investing Program Type Prediction” dataset associated with this code should work perfectly. From what I can tell, this was data aggregated by a bank somewhere in the world that represents its customers’ behavior.
Everything has been anonymized, of course, so there’s no way for us to know which bank we’re talking about, who the customers were, or even where in the world all this was happening. In fact, I’m not even 100% sure what each column of data represents.
What is clear is that each customer’s age and neighborhood are there. Although the locations have been anonymized as C1, C2, C3 and so on, some of the remaining columns clearly contain financial information.
Based on those assumptions, my ultimate goal is to search for statistically valid relationships between columns. For instance, are there specific demographic features (income, neighborhood, age) that predict a greater likelihood of a customer purchasing additional banking products? For this specific example I’ll see if I can identify the geographic regions within the data whose average household wealth is the highest.
For normal uses, such vaguely described data would be worthless. But since we’re just looking to demonstrate the process it’ll do just fine. I’ll make up column headers that more or less fit the shape of their data. Here’s how I named them:
The column names need to be very descriptive because those will be the only clues I’ll give GPT to help it understand the data. I did have to add my own customer IDs to that first column (they didn’t originally exist).
The fastest way I could think of to do that was to insert the =(RAND()) formula into the top data cell in that column (with the file loaded into spreadsheet software like Excel, Google Sheets, or LibreOffice Calc) and then apply the formula to the rest of the rows of data. When that’s done, all the 1,000 data rows will have unique IDs, albeit IDs between 0 and 1 with many decimal places.
How to Apply LlamaIndex to the Problem
With my data prepared, I’ll use LlamaIndex to get to work analyzing the numbers. As before, the code I’m going to execute will:
-
Import the necessary functionality
-
Add my OpenAI API key
-
Read the data file that’s in the directory called
data -
Build the nodes from which we’ll populate our index
import osimport openaifrom llama_index import SimpleDirectoryReaderfrom llama_index.node_parser import SimpleNodeParserfrom llama_index import GPTVectorStoreIndexos.environ['OPENAI_API_KEY'] = "sk-XXXX"documents = SimpleDirectoryReader('data').load_data()parser = SimpleNodeParser()nodes = parser.get_nodes_from_documents(documents)index = GPTVectorStoreIndex.from_documents(documents)Finally, I’ll send my prompt:
response = index.query( "Based on the data, which 5 geographic regions had the highest average household net wealth? Show me nothing more than the region codes")print(response)Here it is again in a format that’s easier on the eyes:
Based on the data, which 5 geographic regions had the highest household net wealth?
I asked this question primarily to confirm that GPT understood the data. It’s always good to test your model just to see if the responses you’re getting seem to reasonably reflect what you already know about the data.
To answer properly, GPT would need to figure out what each of the column headers means and the relationships between columns. In other words, it would need to know how to calculate net worth for each row (account ID) from the values in the Total household assets, Total household debt, and Total investments with bank columns. It would then need to aggregate all the net worth numbers that it generated by Geographic location, calculate averages for each location and, finally, compare all the averages and rank them.
The result? I think GPT nailed it. After a minute or two of deep and profound thought (and around $0.25 in API charges), I was shown five location codes (G0, G90, G96, G97, G84, in case you’re curious). This tells me that GPT understands the location column the same way I did and is at least attempting to infer relationships between location and demographic features.
What did I mean “I think”? Well I never actually checked to confirm that the numbers made sense. For one thing, this isn’t real data anyway and, for all I know, I guessed the contents of each column incorrectly.
But also because every data analysis needs checking against the real world so, in that sense, GPT-generated analysis is no different. In other words, whenever you’re working with data that’s supposed to represent the real world, you should always find a way to calibrate your data using known values to confirm that the whole thing isn’t a happy fantasy.
I then asked a second question that reflects a real-world query that would interest any bank:
Based on their age, geographic location, number of annual visits to bank branch, and total current investments, who are the ten customers most likely to invest in a new product offering? Show me only the value of the
customer IDcolumns for those ten customers.
Once again GPT spat back a response that at least seemed to make sense. This question was also designed to test GPT on its ability to correlate multiple metrics and submit them to a complex assessment (“…most likely to invest in a new product offering”).
I’ll rate that as another successful experiment.
Wrapping Up
GPT – and other LLMs – are capable of independently parsing, analyzing, and deriving insights from large data sets.
There will be limits to the magic, of course. GPT and its cousins can still hallucinate – especially when your prompts give it too much room to be “creative” or, sometimes, when you’ve been gone too deep into a single prompt thread. And there are also some hard limits to how much data OpenAI will allow you to upload.
But, overall, you can accomplish more and faster than you can probably imagine right now.
While all that greatly simplifies the data analytics process, success still depends on understanding the real-world context of your data and coming up with specific and clever prompts. That’ll be your job.
This article is excerpted from my Manning book, The Complete Obsolete Guide to Generative AI. There’s plenty more technology goodness available through my website.