
包阅导读总结
1.
关键词:Sentry LLM Monitoring、AI 应用、成本、性能、错误
2.
总结:Sentry 推出 LLM Monitoring(目前处于测试阶段),适用于 Business 和 Enterprise 计划,可帮助监控 AI 应用的成本、性能和错误,通过安装 SDK 和相关集成即可使用,且免费包含在特定计划中,能让开发者更有效监控 AI 应用。
3.
主要内容:
– Sentry LLM Monitoring 适用于监控 AI 应用
– 与常规应用监控需求的上下文不同
– 帮助调试问题和控制 LLM 令牌成本
– 对 LLM 应用的监控
– 控制成本:通过仪表盘和警报监控令牌使用和成本
– 提升性能:查看 AI 管道性能,追溯导致调用 LLM 缓慢的事件序列
– 处理错误:聚合错误事件,提供高效调试
– 如何开始使用
– 安装最新版 Sentry Python SDK 及 LLM 提供商的集成
– 使用 LLM 协调器或标记管道等方式配置
– Sentry 用 LLM Monitoring 调试 Autofix
– 分析相关情况,确保准确快速提供结果
– Sentry LLM Monitoring 的优势
– 提供调试上下文和可见性
– 计算令牌成本和使用
– 免费包含在特定计划中,欢迎反馈
思维导图: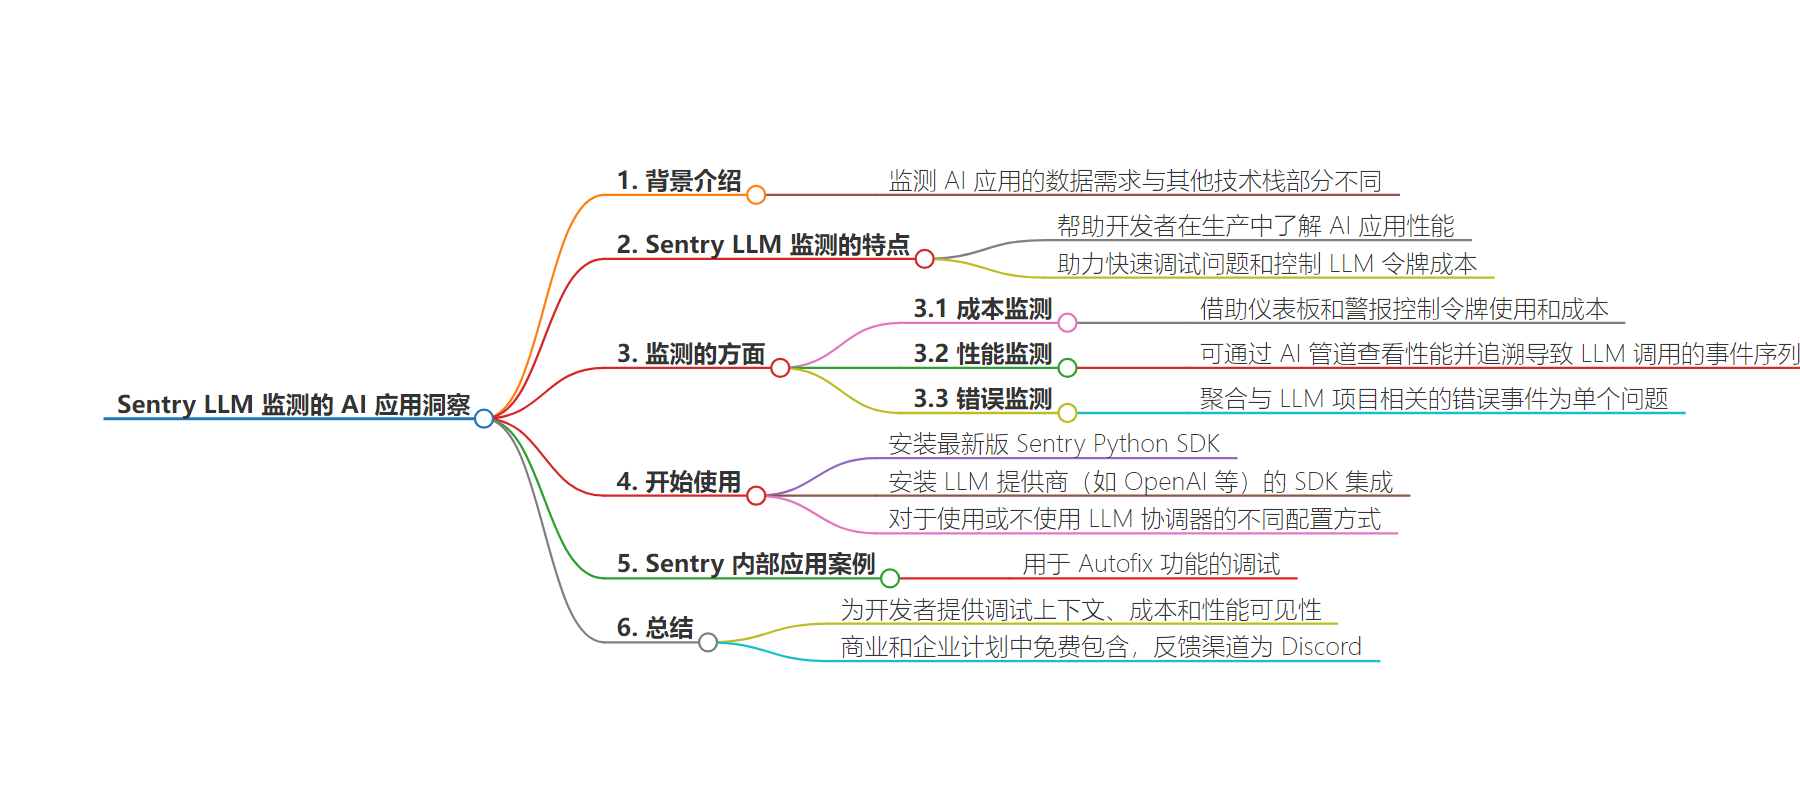
文章地址:https://blog.sentry.io/ai-application-insights-with-sentry-llm-monitoring/
文章来源:blog.sentry.io
作者:Sentry Blog
发布时间:2024/7/9 0:00
语言:英文
总字数:690字
预计阅读时间:3分钟
评分:83分
标签:人工智能监控,性能管理,成本控制,大型语言模型,Sentry
以下为原文内容
本内容来源于用户推荐转载,旨在分享知识与观点,如有侵权请联系删除 联系邮箱 media@ilingban.com
AI Application Insights with Sentry LLM Monitoring
The data you need to monitor AI-powered applications differs from other parts of your tech stack. Whether you need to debug an error, improve performance, or better understand costs, the context you need for an app calling a large language model (LLM) is different from an app that isn’t.
To help developers understand how their AI-powered applications are performing in production, we built Sentry LLM Monitoring (currently in beta), our newest addition to Insights – now available to all Business and Enterprise plans.
Whether you’re running a chatbot, recommendation system, or any LLM-powered application, Sentry LLM Monitoring helps you debug issues fast and control your LLM token costs.
Event
Behind the Code
We recently convened a talented group of experts to discuss what’s next for backend development.
WATCH THE DISCUSSION
Monitoring LLM applications for cost, performance, and errors
Token costs for LLM-powered applications can add up fast. Sentry LLM Monitoring helps keep token usage and cost in check with dashboards and alerts across all your models or through an AI pipeline.
When your app experiences a slowdown, you can view performance by AI pipeline and trace the slowdown back to the sequence of events leading to the LLM call. This means if your app is taking longer than expected to respond, you can look at all the spans and child spans within related services and even view the prompt sent to the model.
Like any part of your tech stack, errors are bound to happen. Sentry will aggregate error events related to your LLM project into a single issue, as we do for every other part of your tech stack. With metadata like the user prompt, model version, and tags, you can efficiently debug production issues like API errors and invalid model inputs.
Getting started
To get started, all you have to do is install the latest version of the Sentry Python SDK, and install the Sentry Python SDK integration for LLM providers like OpenAI, Anthropic, Cohere, Hugging Face, or LangChain.
If you’re using an LLM orchestrator (e.g., LangChain) to create pipelines for one or more LLMs, then Sentry will reference how the pipelines are named in the orchestrator. This allows Sentry to show a table of the AI pipelines and pull the token usage from your LLMs.
If you’re not using an orchestrator, you need to mark your pipelines with the @ai_track decorator and (optionally) send prompts to Sentry with the allow_default_pii=True option to the sentry.init call. Learn more about the configuration process in our docs here.
How Sentry uses LLM Monitoring to debug Autofix
Sentry’s Autofix feature is like having a junior developer on-demand. It analyzes linked git repositories and issue details, summarizes its findings and the root cause, and then drafts a pull request for you to review. Behind the scenes, there are a number of AI pipelines for things like indexing the codebase, analyzing the issue, generating the root cause analysis, and the potential fix.
To make sure we’re providing results quickly and accurately, we’re using LLM Monitoring to know when errors happen, if costs increase, or if there’s a slowdown. For example, recently, the root cause analysis AI pipeline experienced a slowdown. The dashboard showed that one span was taking significantly longer than the others. By viewing example chat completion child spans containing LLM prompts and responses, the team could identify changes to how the data passes to the LLM that would lower response iterations and improve performance.
Understand what your AI application is thinking
Sentry LLM Monitoring gives developers the debugging context and visibility into the cost and performance they need to make their AI-powered applications more effective and efficient. With automatic token cost and usage calculation, context like the model version, user prompts, and the sequence of calls to the LLM help you resolve issues fast and keep costs under control.
Speaking of costs, Sentry LLM Monitoring is included for free with the Business and Enterprise Plans. If you experience issues or have general feedback on LLM Monitoring, please share it with us on Discord.