
包阅导读总结
1. `Kubernetes 1.31`、`kubectl debug`、`Custom Profiling`、`静态配置文件`、`扩展功能`
2. Kubernetes 1.31 中,kubectl debug 的自定义分析功能已升级到测试版。静态配置文件有局限性,自定义分析可扩展,但有字段限制,仅支持修改容器相关字段。
3.
– Kubernetes 1.31 中 kubectl debug 的相关内容
– 介绍:是排查集群中 pods 和 nodes 问题的常用工具,提供静态配置文件,但有固有局限性。
– 自定义分析功能
– 简介:通过 `–custom` 标志引入,提供扩展性,以 YAML 或 JSON 格式接受部分容器规范。
– 示例:包括修改环境变量等。
– 约束:某些字段不允许自定义,未来可能有更多限制。
– 局限:仅支持修改容器相关字段。
– 致谢:感谢相关贡献者。
思维导图: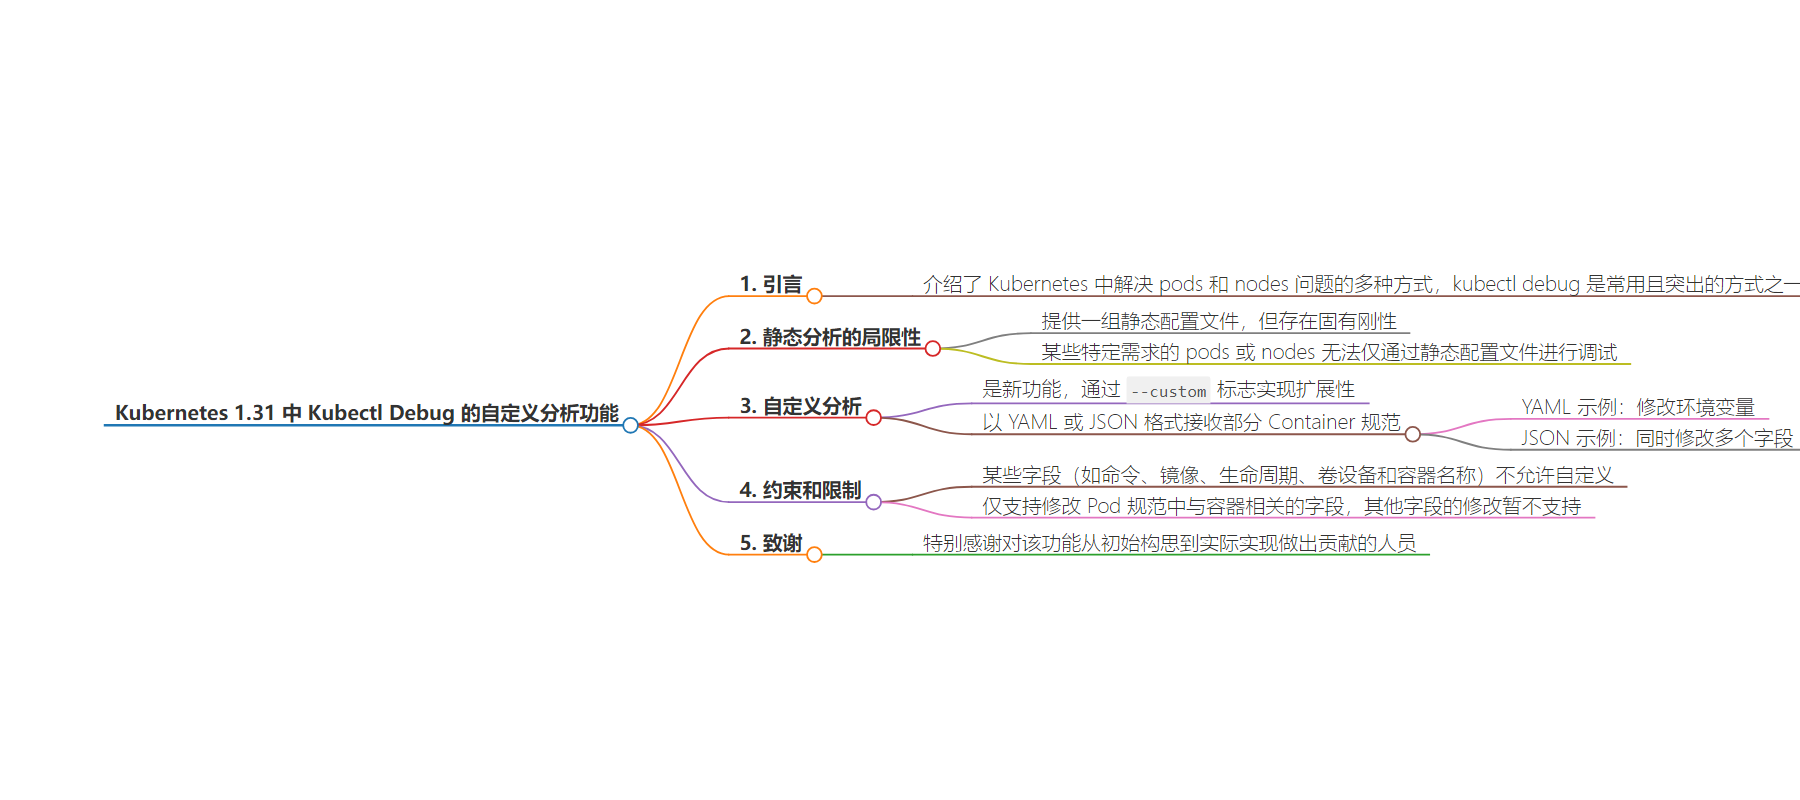
文章地址:https://kubernetes.io/blog/2024/08/22/kubernetes-1-31-custom-profiling-kubectl-debug/
文章来源:kubernetes.io
作者:Kubernetes Blog
发布时间:2024/8/22 0:00
语言:英文
总字数:464字
预计阅读时间:2分钟
评分:89分
标签:Kubernetes,kubectl debug,自定义调试,容器规范,调试
以下为原文内容
本内容来源于用户推荐转载,旨在分享知识与观点,如有侵权请联系删除 联系邮箱 media@ilingban.com
Kubernetes 1.31: Custom Profiling in Kubectl Debug Graduates to Beta
By Arda Güçlü (Red Hat) |
There are many ways of troubleshooting the pods and nodes in the cluster. However, kubectl debug is one of the easiest, highly used and most prominent ones. Itprovides a set of static profiles and each profile serves for a different kind of role. For instance, from the network administrator’s point of view,debugging the node should be as easy as this:
$ kubectl debug node/mynode -it --image=busybox --profile=netadminOn the other hand, static profiles also bring about inherent rigidity, which has some implications for some pods contrary to their ease of use.Because there are various kinds of pods (or nodes) that all have their specificnecessities, and unfortunately, some can’t be debugged by only using the static profiles.
Take an instance of a simple pod consisting of a container whose healthiness relies on an environment variable:
apiVersion: v1kind: Podmetadata: name: example-podspec: containers: - name: example-container image: customapp:latest env: - name: REQUIRED_ENV_VAR value: "value1"Currently, copying the pod is the sole mechanism that supports debugging this pod in kubectl debug. Furthermore, what if user needs to modify the REQUIRED_ENV_VAR to something differentfor advanced troubleshooting?. There is no mechanism to achieve this.
Custom Profiling
Custom profiling is a new functionality available under --custom flag, introduced in kubectl debug to provide extensibility. It expects partial Container spec in either YAML or JSON format.In order to debug the example-container above by creating an ephemeral container, we simply have to define this YAML:
# partial_container.yamlenv: - name: REQUIRED_ENV_VAR value: value2and execute:
kubectl debug example-pod -it --image=customapp --custom=partial_container.yamlHere is another example that modifies multiple fields at once (change port number, add resource limits, modify environment variable) in JSON:
{ "ports": [ { "containerPort": 80 } ], "resources": { "limits": { "cpu": "0.5", "memory": "512Mi" }, "requests": { "cpu": "0.2", "memory": "256Mi" } }, "env": [ { "name": "REQUIRED_ENV_VAR", "value": "value2" } ]}Constraints
Uncontrolled extensibility hurts the usability. So that, custom profiling is not allowed for certain fields such as command, image, lifecycle, volume devices and container name.In the future, more fields can be added to the disallowed list if required.
Limitations
The kubectl debug command has 3 aspects: Debugging with ephemeral containers, pod copying, and node debugging. The largest intersection set of these aspects is the container spec within a PodThat’s why, custom profiling only supports the modification of the fields that are defined with containers. This leads to a limitation that if user needs to modify the other fields in the Pod spec, it is not supported.
Acknowledgments
Special thanks to all the contributors who reviewed and commented on this feature, from the initial conception to its actual implementation (alphabetical order):