包阅导读总结
1. `Requests`、`Third-Party APIs`、`Debugging`、`HTTP Requests`、`Sentry`
2. 本文主要介绍了 Sentry 新增的 Insights 中的 Requests 功能,用于调试第三方 API 的 HTTP 请求,包括其能解决的问题如判断服务故障范围、应对速率限制、追踪集成错误等,适用于商业和企业计划,还提及获取反馈的途径。
3.
– 介绍 Requests 功能
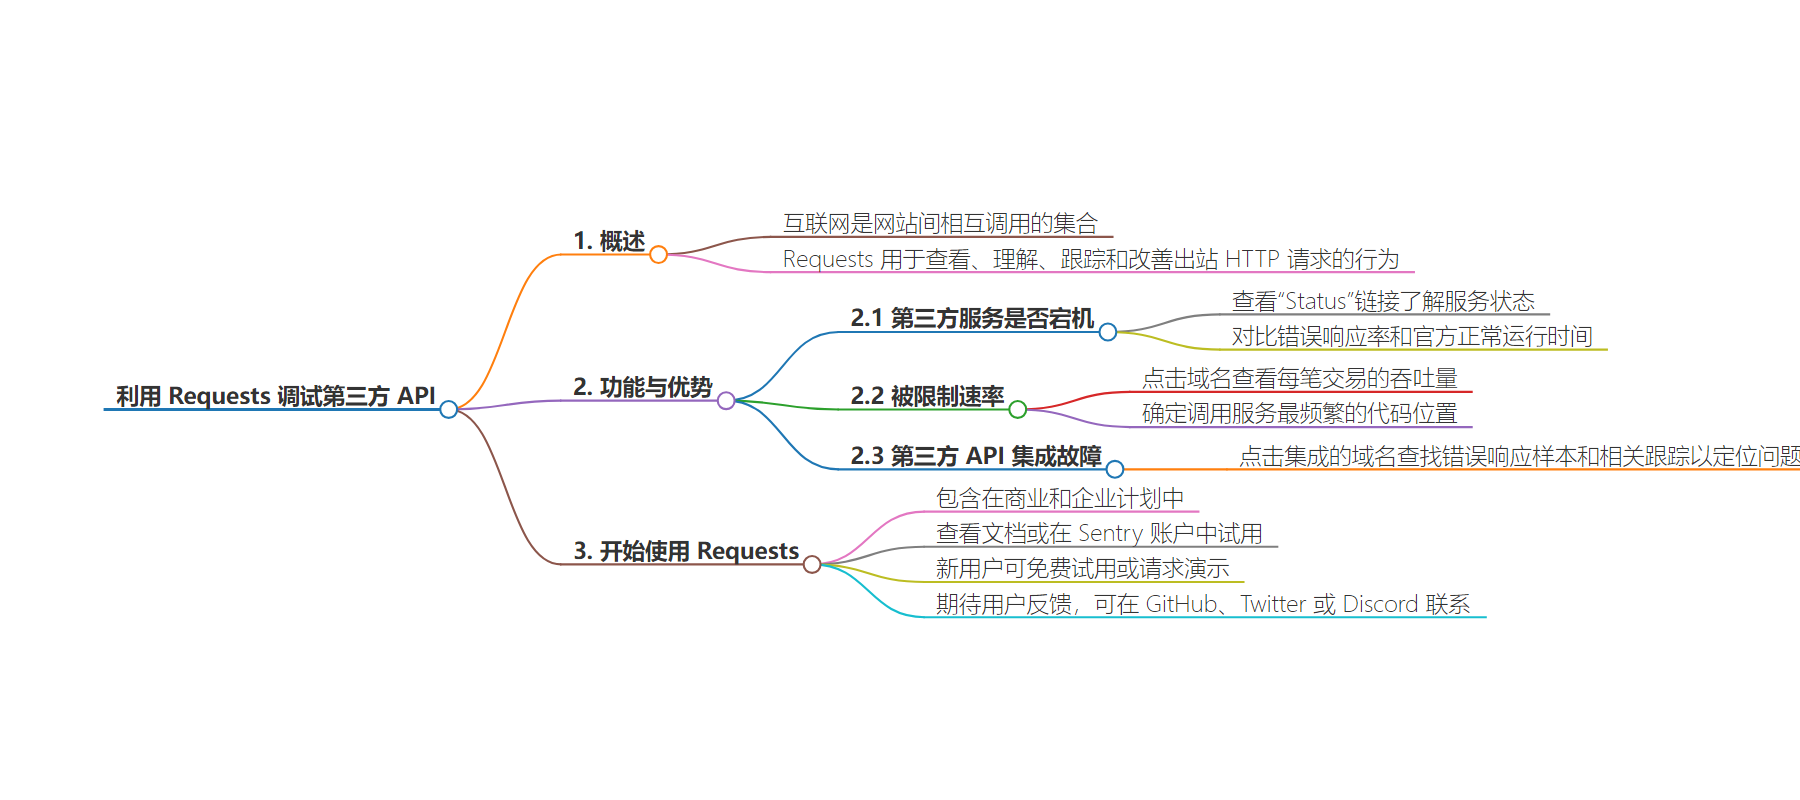
– 可查看、理解、跟踪和改善传出 HTTP 请求的行为
– 帮助收集相关信息,提供连接的调试工作流程
– 解决的常见问题
– 判断第三方服务故障范围
– 应对速率限制
– 追踪第三方 API 集成错误
– 开始使用 Requests
– 包含在商业和企业计划中
– 可查看文档或在账户中试用
– 新用户可免费试用或请求演示
– 期待用户反馈,可在 GitHub、Twitter 或 Discord 联系
思维导图:
文章地址:https://blog.sentry.io/debug-third-party-apis-with-requests/
文章来源:blog.sentry.io
作者:Sentry Blog
发布时间:2024/7/10 0:00
语言:英文
总字数:434字
预计阅读时间:2分钟
评分:84分
标签:调试,API管理,性能监控,仙特瑞,网页开发
以下为原文内容
本内容来源于用户推荐转载,旨在分享知识与观点,如有侵权请联系删除 联系邮箱 media@ilingban.com
The internet is basically just a bunch of websites calling each other. You make a call to some service, that service calls you back, and then that service goes down and ruins your afternoon. Requests, our latest addition to Insights, is a place to see, understand, track, and improve the behavior of outgoing HTTP requests. Whether you’re making calls to a popular third-party API, or to your own in-house services, the Requests view helps gather all that information in one spot and gives you a connected debugging workflow to troubleshoot issues as they arise.
Your problems, our solutions
Requests in Insights is a great place to see how often you’re calling other services, how long those requests are taking, and other interesting information like spikes in 3xxs, 4xxs, or 5xxs error codes. That’s all fine and well for academic interest, but here are some common real-life problems the Requests feature helps solve.
Down for everyone or just me?
How do you quickly figure out whether a third-party service is down for everyone or just you? In Requests, it’s very simple. For popular third-party services, the “Status” link leads you to the service’s uptime page. Check your error response rates against the official uptime to see if you’re the only one experiencing errors. P.S. Our list of popular status pages is open source; feel free to contribute your favorites.
Help, I’m being rate-limited
Sometimes, you flood a service with requests, and it simply gives up. 409s abound, and you’ll have to figure out how to reduce your usage of the service. With Requests, this is simpler than ever! Click on that domain, and check the throughput per transaction to see where in your code you’re calling that service most often:
A feature is broken, but not my feature
If your application makes calls to third-party APIs, you’ll get the occasional bug report that the integration isn’t working. With Requests, this is easy to track down. You can click the integration’s domain, find samples of error responses, and look at the relevant traces to find the problem:
Getting Started with Requests
Requests is included in our Business and Enterprise plans. To get started, check out the docs or try it out now in your Sentry account. And if you’re new to Sentry, you can try it for free today or request a demo to get started.
We also want your feedback and to hear how you’re using Request – drop us a line on GitHub, Twitter, or Discord.
