包阅导读总结
1. 关键词:
– Quarkus
– Micrometer
– Metrics
– Monitoring
– Application Performance
2. 总结:
本文介绍了 Quarkus 中的 Micrometer,包括其优势(无缝集成、多后端支持等)和劣势(学习曲线、开销等),还说明了添加 Maven 依赖、使用计数器、计时器和测量仪的示例,最后总结强调其对收集和暴露 Quarkus 应用指标的作用,有助于监控应用性能。
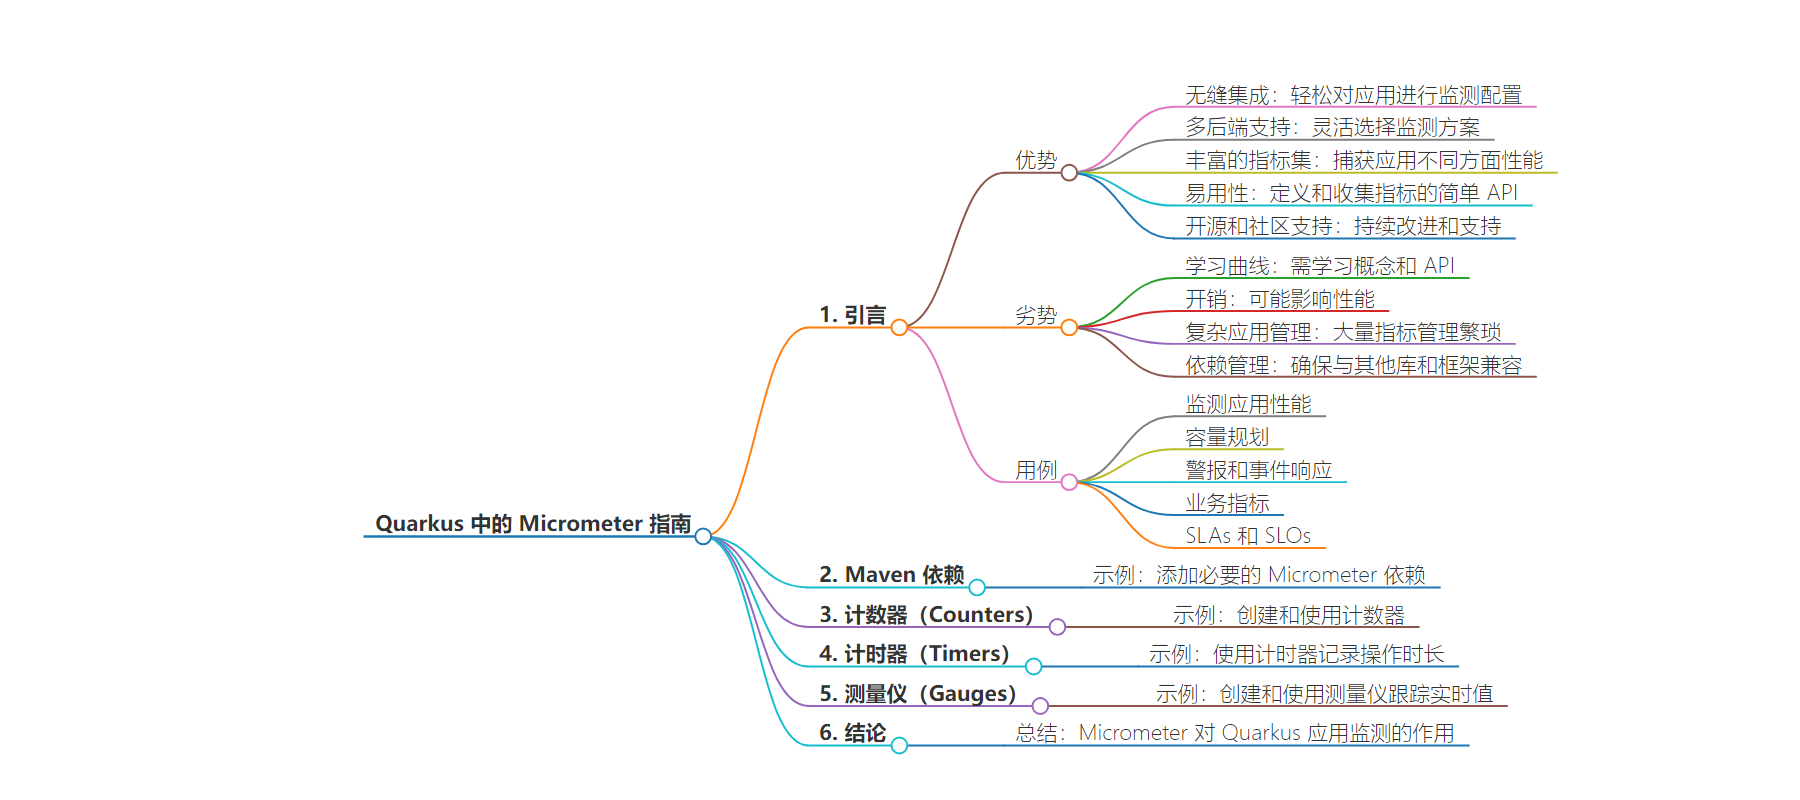
3. 主要内容:
– 介绍
– Quarkus 中 Micrometer 概述
– 优势
– 无缝集成
– 多后端支持
– 丰富的指标类型
– 易用
– 开源及社区支持
– 劣势
– 学习曲线
– 开销
– 复杂应用管理困难
– 依赖管理
– 用例
– 监控应用性能
– 容量规划
– 警报和事件响应
– 业务指标
– SLAs 和 SLOs
– Maven 依赖
– 示例添加依赖
– 计数器
– 概念
– Quarkus 应用中创建和使用示例
– 计时器
– 用途
– Quarkus 应用中使用示例
– 测量仪
– 作用
– Quarkus 应用中使用示例
– 结论
– 强调 Micrometer 在 Quarkus 应用中的重要性
思维导图:
文章地址:https://www.javacodegeeks.com/a-guide-to-micrometer-in-quarkus.html
文章来源:javacodegeeks.com
作者:Yatin Batra
发布时间:2024/7/17 15:28
语言:英文
总字数:856字
预计阅读时间:4分钟
评分:90分
标签:Quarkus,Micrometer,Metrics,Monitoring,Java
以下为原文内容
本内容来源于用户推荐转载,旨在分享知识与观点,如有侵权请联系删除 联系邮箱 media@ilingban.com
In this article, we will explore and gain a comprehensive understanding of Micrometers in Quarkus.
1. Introduction
Micrometer is a powerful metrics collection library that provides a simple facade over the instrumentation clients for various monitoring systems. It supports a wide range of monitoring backends, including Prometheus, Graphite, and many others. Quarkus, a Kubernetes-native Java framework tailored for GraalVM and OpenJDK HotSpot, integrates seamlessly with Micrometer, making it easy to capture and expose metrics from your Quarkus applications.
1.1 Advantages
- Seamless Integration: Micrometer integrates effortlessly with Quarkus, making it easy to instrument applications without extensive configuration.
- Multi-backend Support: It supports multiple monitoring systems like Prometheus, Graphite, and more, allowing flexibility in choosing the monitoring solution.
- Rich Set of Metrics: Provides various types of metrics (counters, timers, gauges) to capture different aspects of application performance.
- Ease of Use: Simple API for defining and collecting metrics, reducing the complexity of monitoring implementation.
- Open-source and Community Support: Active development and a large community provide continuous improvements and support.
1.2 Disadvantages
- Learning Curve: Developers need to learn Micrometer concepts and APIs, which might be time-consuming initially.
- Overhead: Instrumentation can introduce additional overhead, potentially impacting performance if not used judiciously.
- Complexity in Large Applications: Managing a large number of metrics in complex applications can become cumbersome.
- Dependency Management: Requires careful management of dependencies to ensure compatibility with other libraries and frameworks.
1.3 Use Cases
- Monitoring Application Performance: Track request counts, response times, and error rates to ensure application reliability and performance.
- Capacity Planning: Measure resource usage (CPU, memory, active sessions) to make informed decisions about scaling and resource allocation.
- Alerting and Incident Response: Set up alerts for abnormal behavior (e.g., a spike in error rates) to quickly identify and respond to issues.
- Business Metrics: Collect custom business metrics (e.g., number of transactions, user registrations) to gain insights into application usage.
- SLAs and SLOs: Monitor service level agreements (SLAs) and service level objectives (SLOs) to ensure compliance with performance standards.
2. Maven Dependency
To use Micrometer in your Quarkus application, you need to add the necessary Micrometer dependencies to your pom.xml file. Below is an example of how to include the Micrometer dependencies:
<dependency> <groupId>io.quarkus</groupId> <artifactId>quarkus-micrometer-registry-prometheus</artifactId></dependency><dependency> <groupId>io.micrometer</groupId> <artifactId>micrometer-core</artifactId></dependency>
These dependencies will pull in the necessary libraries to enable Micrometer and Prometheus support in your Quarkus application.
3. Counters
Counters are a type of metric that represents a single monotonically increasing value. They are typically used to count events or occurrences, such as the number of requests received or the number of errors encountered. To create and use a counter in a Quarkus application, follow these steps:
import io.micrometer.core.instrument.MeterRegistry;import io.micrometer.core.instrument.Counter;import javax.inject.Inject;import javax.ws.rs.GET;import javax.ws.rs.Path;@Path("/counter")public class CounterResource { @Inject MeterRegistry registry; private Counter counter; public CounterResource(MeterRegistry registry) { this.registry = registry; this.counter = registry.counter("my_counter"); } @GET public String incrementCounter() { counter.increment(); return "Counter incremented!"; }}
In this example, we inject the MeterRegistry and use it to create a counter named my_counter. The counter is incremented each time the incrementCounter endpoint is accessed.
4. Timers
Timers are used to measure the duration of events and track the frequency of those events. They provide statistical information about the timing of your operations. To use a timer in a Quarkus application, you can follow this example:
import io.micrometer.core.instrument.MeterRegistry;import io.micrometer.core.instrument.Timer;import javax.inject.Inject;import javax.ws.rs.GET;import javax.ws.rs.Path;import java.util.concurrent.TimeUnit;@Path("/timer")public class TimerResource { @Inject MeterRegistry registry; private Timer timer; public TimerResource(MeterRegistry registry) { this.registry = registry; this.timer = registry.timer("my_timer"); } @GET public String timeOperation() { long start = System.nanoTime(); try { // Simulate some operation Thread.sleep(1000); } catch (InterruptedException e) { Thread.currentThread().interrupt(); } finally { long end = System.nanoTime(); timer.record(end - start, TimeUnit.NANOSECONDS); } return "Operation timed!"; }}
In this example, we create a timer named my_timer and use it to record the duration of a simulated operation. The timer captures the elapsed time in nanoseconds.
5. Gauges
Gauges are metrics that represent a single value at a given point in time. They are useful for tracking values that can go up or down, such as the number of active sessions or the current memory usage. To use a gauge in a Quarkus application, consider the following example:
import io.micrometer.core.instrument.MeterRegistry;import io.micrometer.core.instrument.Gauge;import javax.inject.Inject;import javax.ws.rs.GET;import javax.ws.rs.Path;import java.util.concurrent.atomic.AtomicInteger;@Path("/gauge")public class GaugeResource { @Inject MeterRegistry registry; private AtomicInteger activeSessions; public GaugeResource(MeterRegistry registry) { this.registry = registry; this.activeSessions = new AtomicInteger(0); Gauge.builder("active_sessions", activeSessions, AtomicInteger::get) .register(registry); } @GET @Path("/increment") public String incrementGauge() { activeSessions.incrementAndGet(); return "Gauge incremented!"; } @GET @Path("/decrement") public String decrementGauge() { activeSessions.decrementAndGet(); return "Gauge decremented!"; }}
In this example, we use an AtomicInteger to track the number of active sessions. The gauge is created using the Gauge.builder method and is registered with the MeterRegistry. The gauge is updated each time the incrementGauge or decrementGauge endpoints are accessed.
6. Conclusion
Micrometer provides a powerful and flexible way to collect and expose metrics in your Quarkus applications. By integrating Micrometer with Quarkus, you can easily monitor your application’s performance and gain valuable insights into its behavior. With these tools at your disposal, you can ensure that your applications are running smoothly and efficiently.
