
包阅导读总结
1.
关键词:Grafana Cloud、Application Observability、Anomaly Detection、Root Cause Analysis、Telemetry Signals
2.
总结:Grafana Cloud 推出的 Application Observability 不断开发新功能,以提升用户体验,帮助用户改进异常检测和根本原因分析,文中介绍了时间帧比较、自动基线、分组和筛选、上下文导航等功能,还提供了使用的步骤。
3.
主要内容:
– Grafana Cloud Application Observability 是为提升现代应用可靠性的解决方案
– 原生支持 OpenTelemetry 和 Prometheus,助开发者和 SREs 统一应用和基础设施洞察
– 新功能增强用户体验和应用性能洞察
– 时间帧比较,可对比不同时间段服务指标
– 自动基线,考虑季节性,用标准差判断模式是否正常
– 分组和筛选,探索不同属性对性能的影响,缩小问题维度
– 上下文导航,从面板到跟踪和日志,加速根本原因分析
– 开始使用的步骤
– 启用 Grafana Cloud 指标生成
– 用 OpenTelemetry 检测应用
– 使用 Grafana Alloy 或 OpenTelemetry Collector 发送数据
– 参考文档获取更多详情和最佳实践
思维导图: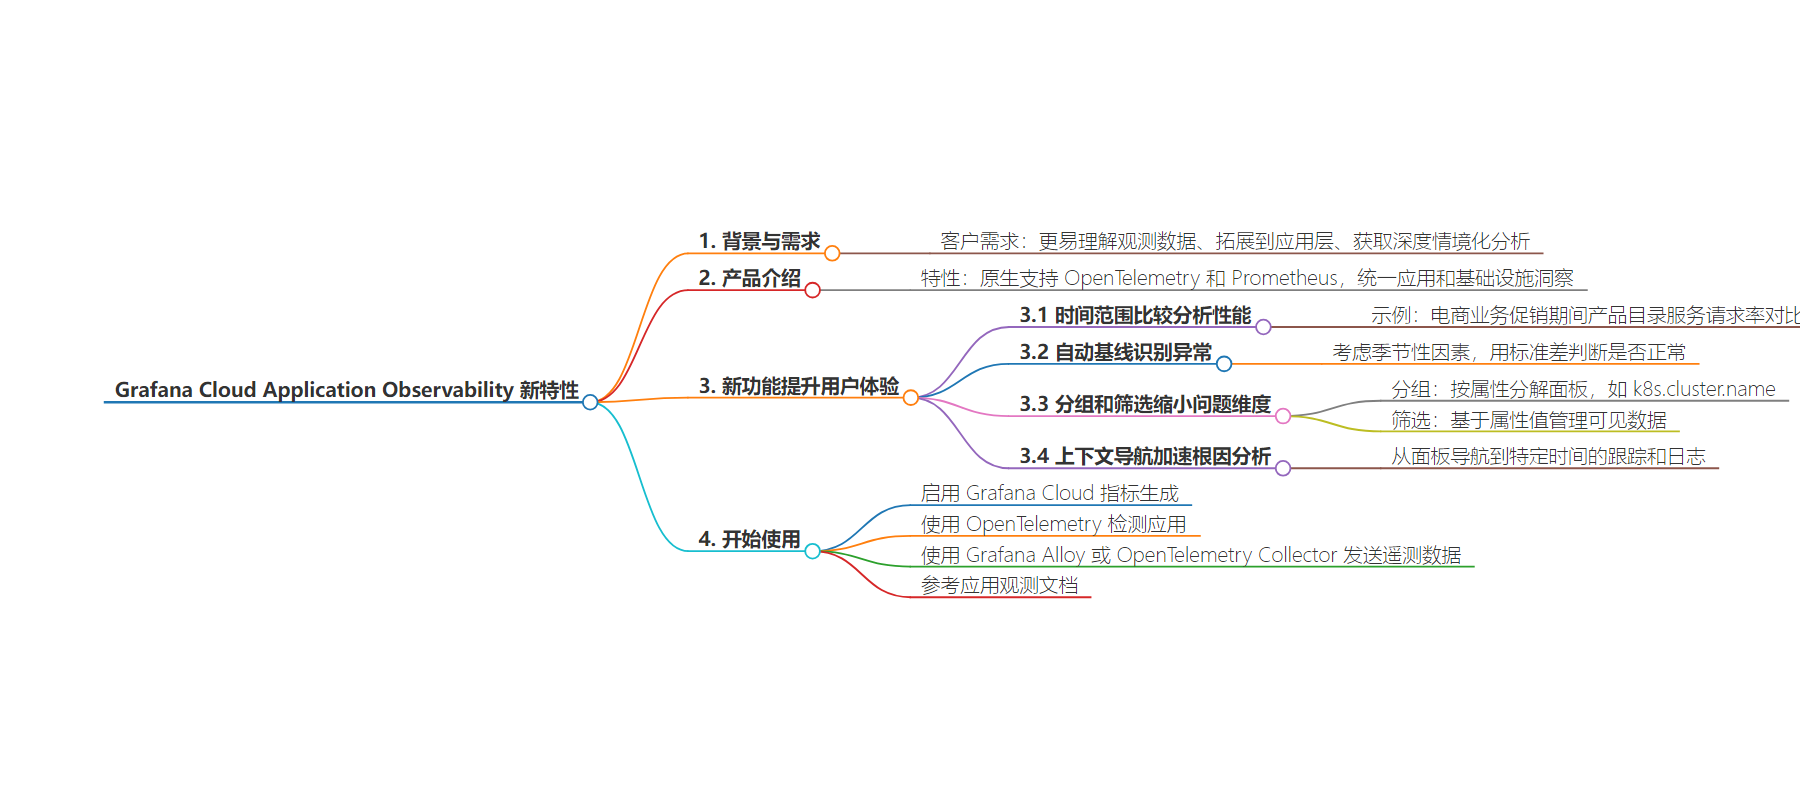
文章来源:grafana.com
作者:Cedric Ziel
发布时间:2024/8/16 16:44
语言:英文
总字数:932字
预计阅读时间:4分钟
评分:91分
标签:应用可观测性,Grafana云
以下为原文内容
本内容来源于用户推荐转载,旨在分享知识与观点,如有侵权请联系删除 联系邮箱 media@ilingban.com
In recent years, “the biggest needs we’ve heard from our customers have been to make it easier to understand their observability data, to extend observability into the application layer, and to get deeper, contextualized analytics,” said Tom Wilkie, CTO of Grafana Labs, at ObservabilityCON 2023.
In response to that, last year, we introduced Grafana Cloud Application Observability, an opinionated, out-of-the-box solution designed to improve the reliability of modern applications. Featuring native support for both OpenTelemetry and Prometheus, Application Observability in Grafana Cloud helps developers and SREs seamlessly unify application and infrastructure insights — an essential capability to accelerate anomaly detection and root cause analysis, reduce MTTR, and advance your overall observability strategy.
Since we announced the general availability of Application Observability last fall, we’ve been hard at work, developing new features to further enhance the user experience and enable Grafana Cloud users to gain deeper insights into application performance.
Here’s a look at some of the ways you can work with telemetry signals in Application Observability to improve anomaly detection and better understand the behavior of your services.
Note: To see a demo of the latest features in Application Observability, you can check out the YouTube video below.
Analyze performance over time with time frame comparison
When dealing with data, and especially with data over time, there is always the nagging question: “Is what I am seeing normal, or an outlier?”
To help answer this question, we’ve added time frame comparison, an enhancement to the Application Observability user experience that allows you to compare the metrics for a certain service over time periods, such as today vs. yesterday or current month vs. previous months.
Imagine this: You have a big promotion in your e-commerce business and want to understand if the rate of requests to the productcatalog service is still within parameters. To do this in Grafana, you would manually create a panel that uses two different lookback periods. In Application Observability, you can simply toggle the comparison checkbox and to see a band of expected values in comparison to current values. This way, you can rest assured that your services are still performing.
Identify anomalies with automatic baselining
But wait — what about seasonality? To continue with our example above, if you’re an e-commerce business, your busiest months are likely in the second half of the year. In order to account for this seasonality, and ensure apples-to-apples comparisons, we introduced automatic baselining as a way to compare the current timeframe with a baseline in the time window comparison.
Automatic baselining uses standard deviation to help you understand if what you’re seeing is a normal pattern, or deviates from the expected calculation, so you can start troubleshooting quickly.
Application observability is on the rise
The incorporation of app performance into overall observability efforts is an indicator of a mature organization — but, according to the 2024 Grafana Labs Observability Survey, only 41% are actively doing it. Still, 53% say it’s more relevant than last year.
Narrow down problem dimensions with group-by and filter-by
Once you discover an anomaly, either through an alert or the user interface, the next step is to narrow down to the problem: is there a variable that could explain the anomaly?
In Grafana Cloud Application Observability, you can explore how different attributes and their values influence application performance. These attributes are characteristics that are native to your application, such as its deployment coordinates or domain-specific attributes like a department name or geographic location.
Let’s assume you found an anomaly through the baseline comparison and you want to analyze why. You can now use the group-by feature to break down the panel by attributes like k8s.cluster.name and get rate, errors, and duration for every single cluster that hosts your workload. This can help you understand if there is one specific location experiencing poor performance compared to the others.
Once you’ve found the outlier, you can then use the filter-by feature to manage which data is visible based on attribute values. For example, if you grouped data by geographical region and identified that errors are occurring only in the Europe region, you can then filter the data to visualize only the Europe geographical region. You can then repeat that step to further segment data and identify the issue.
Faster root cause analysis with in-context navigation
When seeing patterns on panels, you often want to dig in further, right? Well, now you can in Application Observability. Thanks to Grafana data links, it’s now possible to navigate from panels to traces and logs at a specific point in time.
Let’s walk through another example: imagine you see a spike in duration for service transactions. You want to determine which transactions are taking so long to process, and why that’s the case. By simply clicking on the graph, you can navigate directly to the traces of those transactions within your specified timeframe and filters. This accelerates root cause analysis by quickly pinpointing the problematic traces.
Get started with Application Observability
If you haven’t tried Application Observability in Grafana Cloud, it’s easy to get started with the following steps:
- Opt in for Grafana Cloud metrics generation, if it is not already enabled.
- Instrument your application using OpenTelemetry.
- Use Grafana Alloy with the OpenTelemetry (OTLP) integration (recommended) or the OpenTelemetry Collector to send telemetry data to Grafana Cloud.
For full implementation details and best practices, you can also reference our Application Observability documentation.
Grafana Cloud is the easiest way to get started with application observability. We have a generous forever-free tier that includes 2232 host hours per month and more. Sign up for free now!