
包阅导读总结
1.
关键词:C4 模型、软件架构、架构图、Structurizr、自动化
2.
总结:本文介绍了如何使用 C4 模型创建软件架构图,包括其四个层次(Context、Containers、Components、Code),还提到了补充图表、Diagrams as Code 方式,以 Task Management Software System 为例展示,并介绍了通过 Structurizr DSL 和自动化渲染在 CI 中的应用。
3.
主要内容:
– 为何需要有效清晰的架构图
– 复杂项目中代码解读困难,现有架构图常过时。
– C4 模型
– 由“Context、Containers、Components、Code”构成。
– 以 Google Maps 举例解释概念。
– 四个层次介绍
– Context:系统在大环境中的概览。
– Containers:系统内部各功能单元协作和职责分布。
– Components:应用的主要结构构建块。
– Code:最详细的代码层面。
– 补充图表:如登录流程。
– Diagrams as Code
– 优势:版本控制、协作、自动化。
– 工具:Structurizr 及其 DSL。
– 自动化渲染在 CI 中的应用
– GitHub 上托管模型,通过 GitHub Action 自动化。
– 示例工作流生成静态页面并发布到 GitHub Pages。
– 结论
– 强调创建和维护清晰架构图的重要性。
思维导图: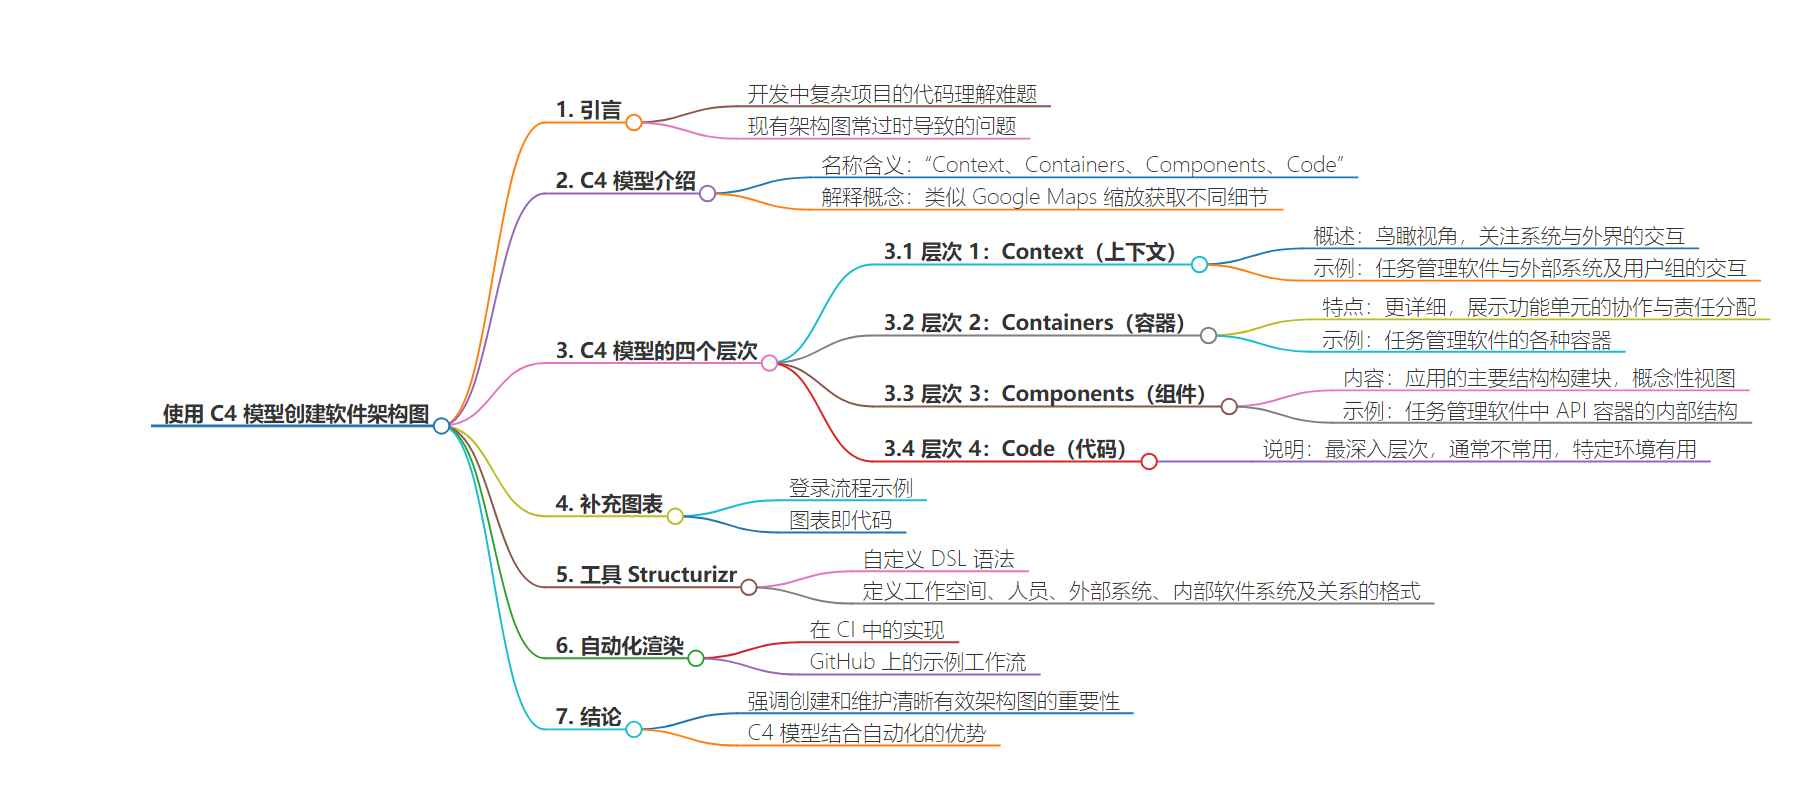
文章地址:https://www.freecodecamp.org/news/how-to-create-software-architecture-diagrams-using-the-c4-model/
文章来源:freecodecamp.org
作者:Alex Pliutau
发布时间:2024/8/21 18:50
语言:英文
总字数:1519字
预计阅读时间:7分钟
评分:91分
标签:软件架构,C4,图表绘制,软件可视化,开发工具
以下为原文内容
本内容来源于用户推荐转载,旨在分享知识与观点,如有侵权请联系删除 联系邮箱 media@ilingban.com
As a developer, you’ll likely work on a complex project at some point where deciphering the codebase feels like reading a whole novel. Engineers are code wizards, but even the best get lost in sprawling code.
The challenge is that architecture diagrams – if they even exist – are often outdated relics from a bygone era.
This is why creating and maintaining effective and clear diagrams should be effortless. Up-to-date visuals ensure everyone stays on the same page, eliminating confusion and wasted time.
Table of Contents
What is the C4 Model?
The C4 model was created as a way to help software development teams describe and communicate software architecture.
C4 stands for “Context, Containers, Components, and Code”. Those are the four levels that should be enough to describe a complex system.
The best way to explain the concept is to think about how we use Google Maps. When we are exploring an area in Google Maps, we will often start zoomed out to help us get context. Once we find the rough area we are interested in we can zoom in to get a little more detail.
Level 1: Context
This level is the most zoomed out. It’s a bird’s eye view of the system in the greater context of the world. The diagram concentrates on actors and systems.
For the examples below, we will use a simple Task Management Software System to demonstrate all these 4 levels.
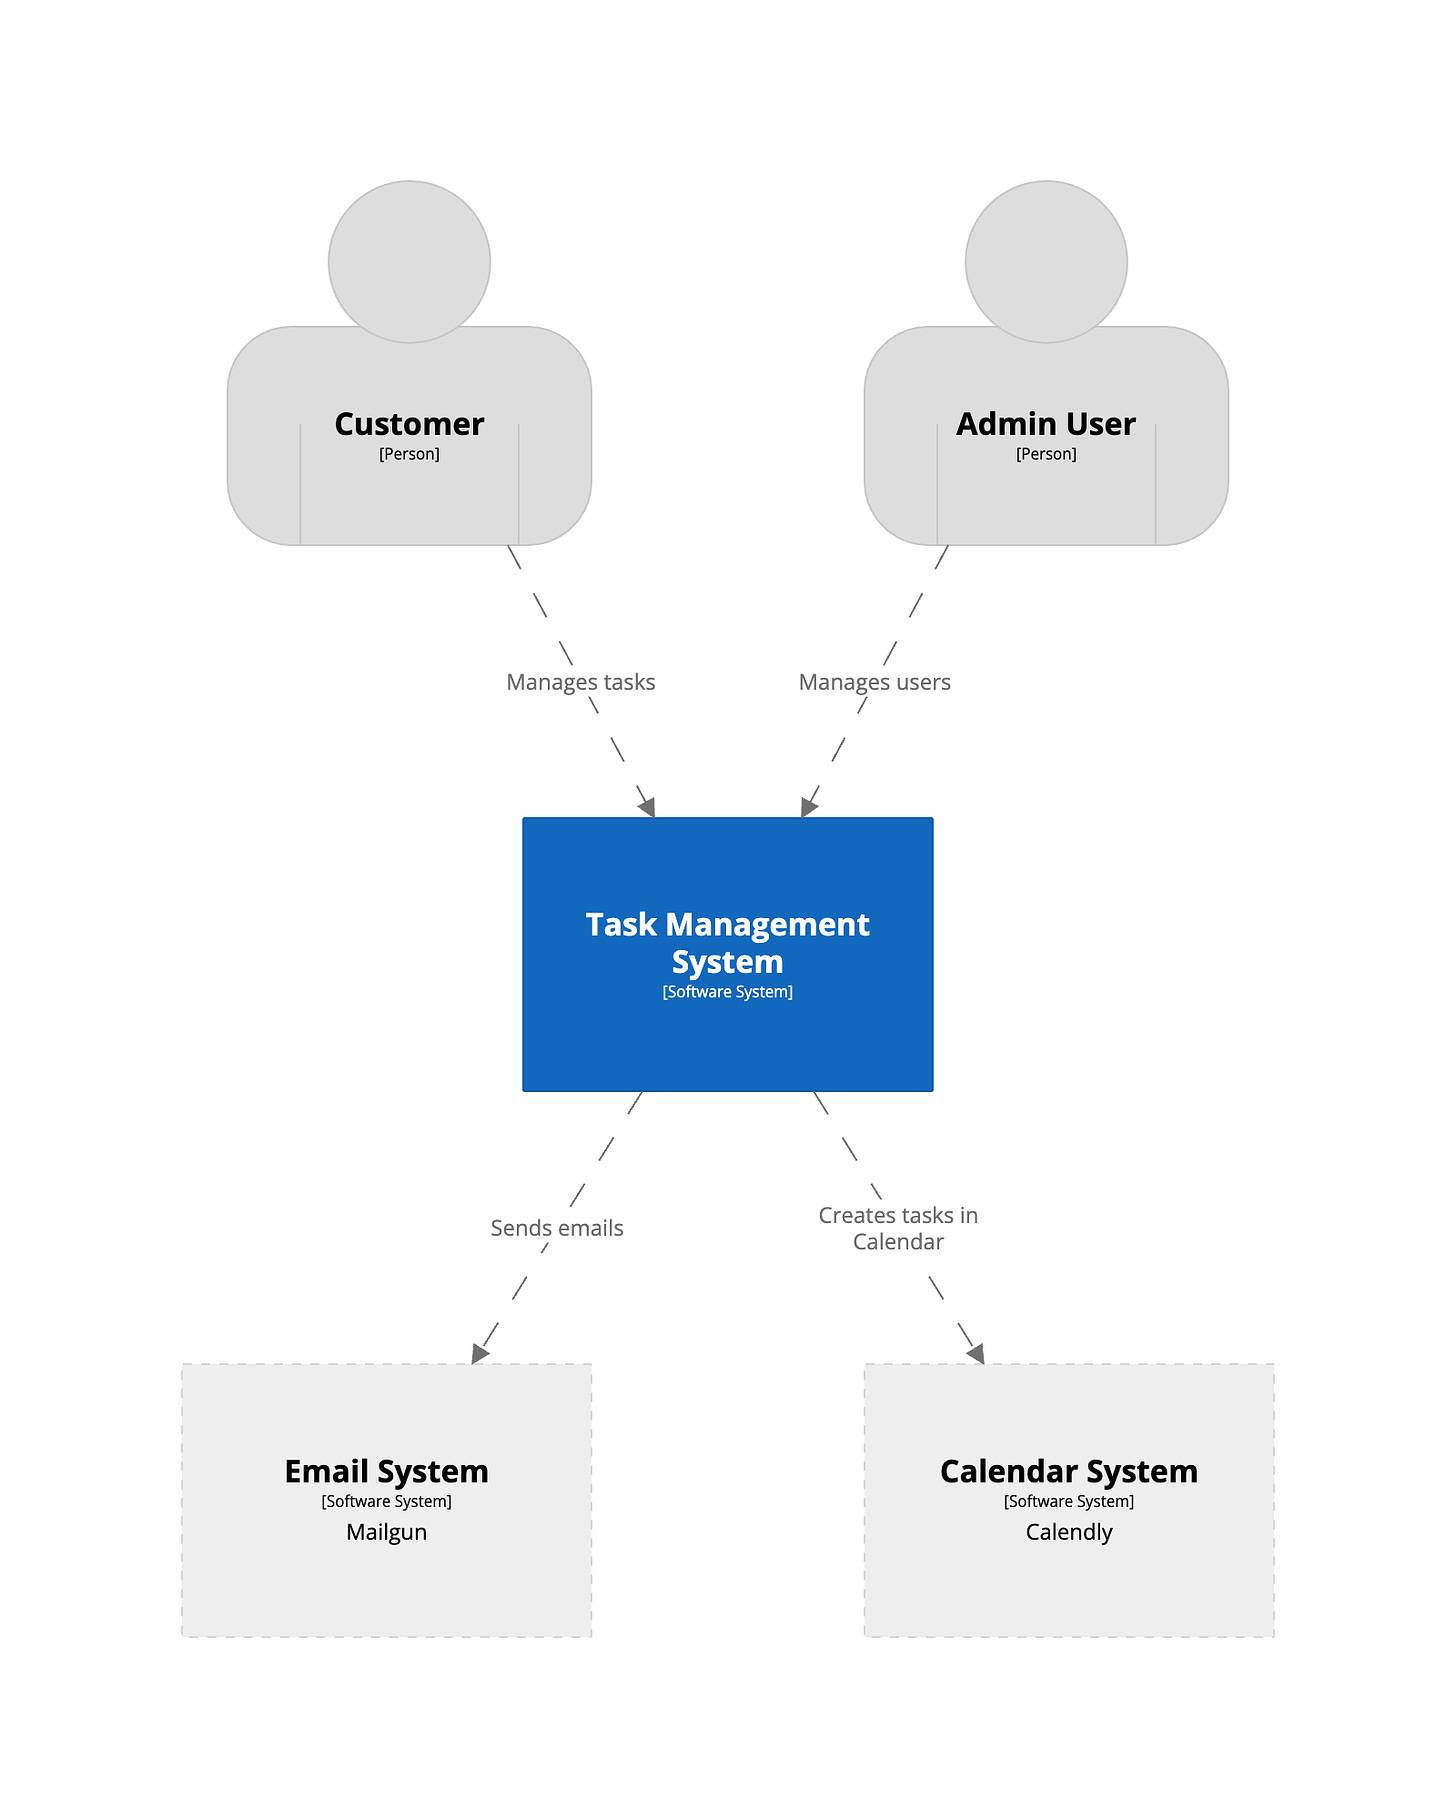
This diagram portrays the Task Management Software System’s interactions with external systems and the different user groups that utilize it. We can see that the Task Management software relies on two external systems: Email and Calendar, and two types of actors (users) use it: Customer and Admin User.
Level 2: Containers
The containers level is a more detailed view of your system (don’t confuse C4 containers with Docker containers).
It reveals how various functional units like applications and databases work together and distribute responsibilities.
This diagram also highlights the key technologies employed and showcases the communication flow between these containers. It presents a simplified, technology-centric view of the system’s core components and their interactions.
If you have Microservice architecture, then each Microservice would be a container.
Examples of containers are:
-
Single page application
-
Web server
-
Serverless function
-
Database
-
API
-
Message buses
And so on.
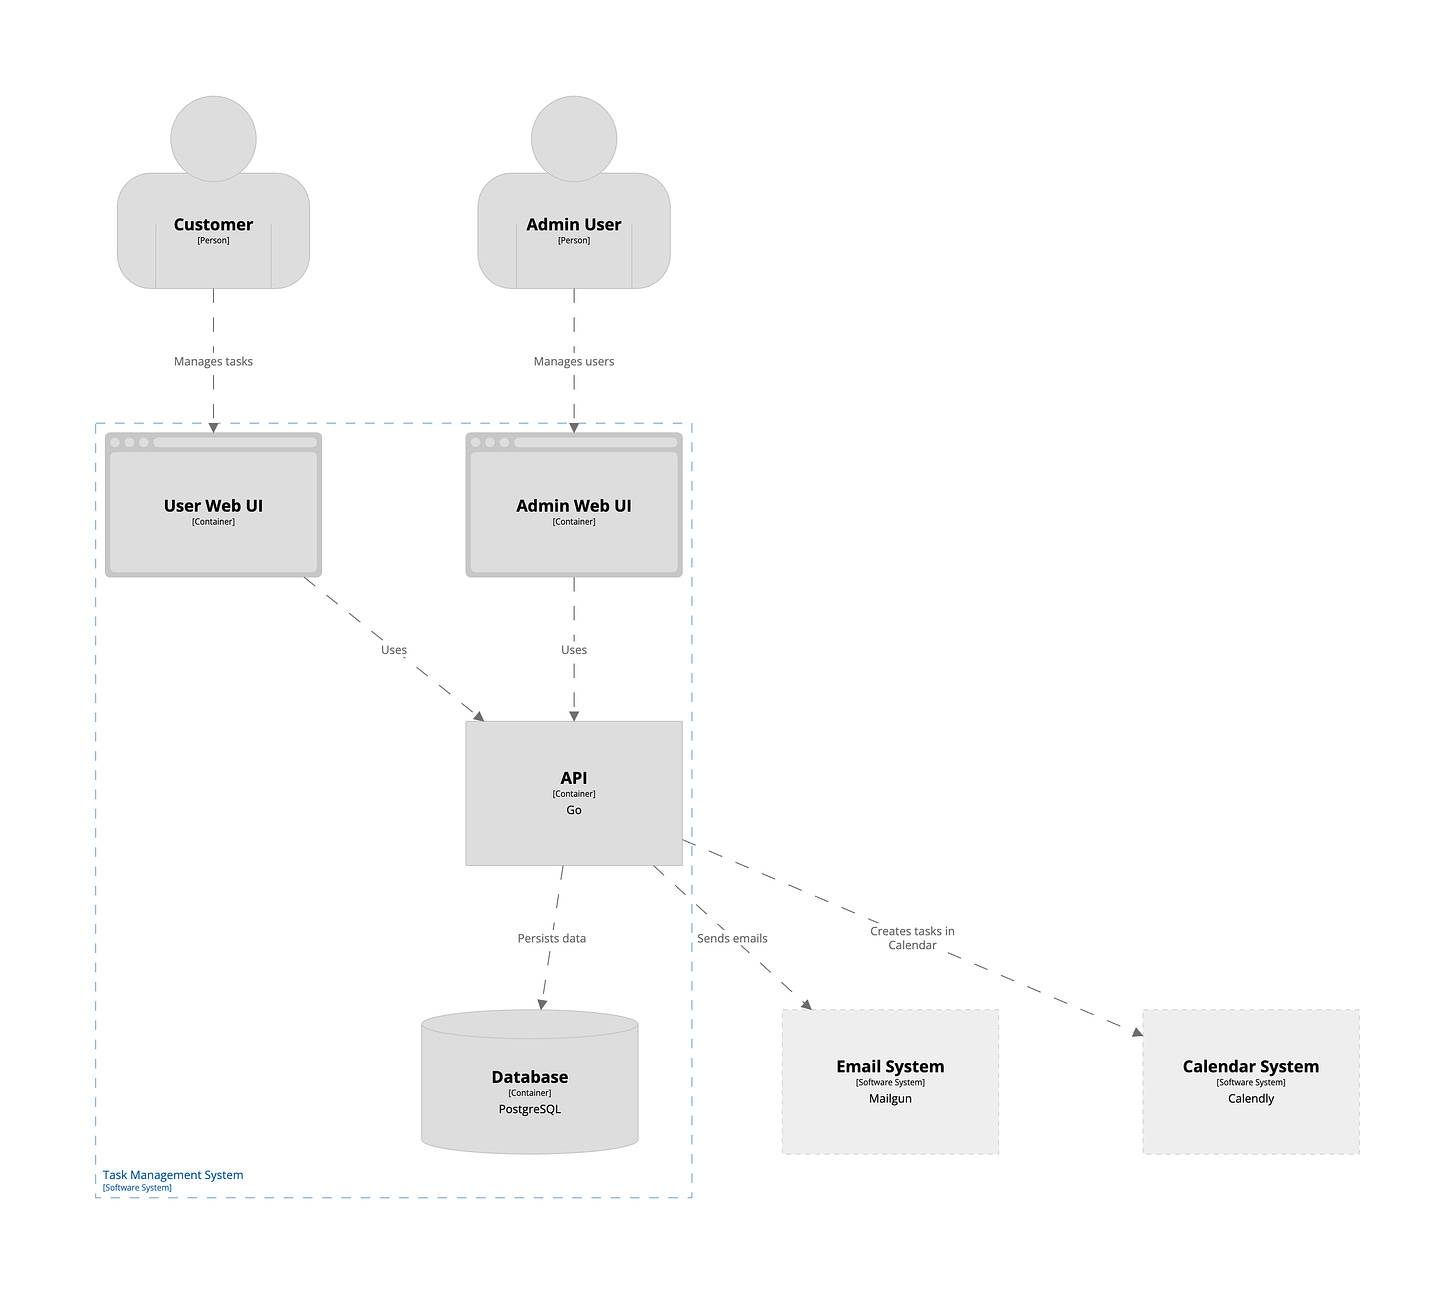
This level delves into the internal composition of the Task Management Software System. It showcases that our Task Management software system consists of containers such as User Web UI, Admin Web UI, API and a Database. API is also the container that is connected to external systems, for example to send emails or create events in calendar.
Level 3: Components
The next level of zoom is components. This shows the major structural building blocks of your application, and is often a conceptual view of the application. The term component is loose here. It could represent a controller or a service containing business logic.
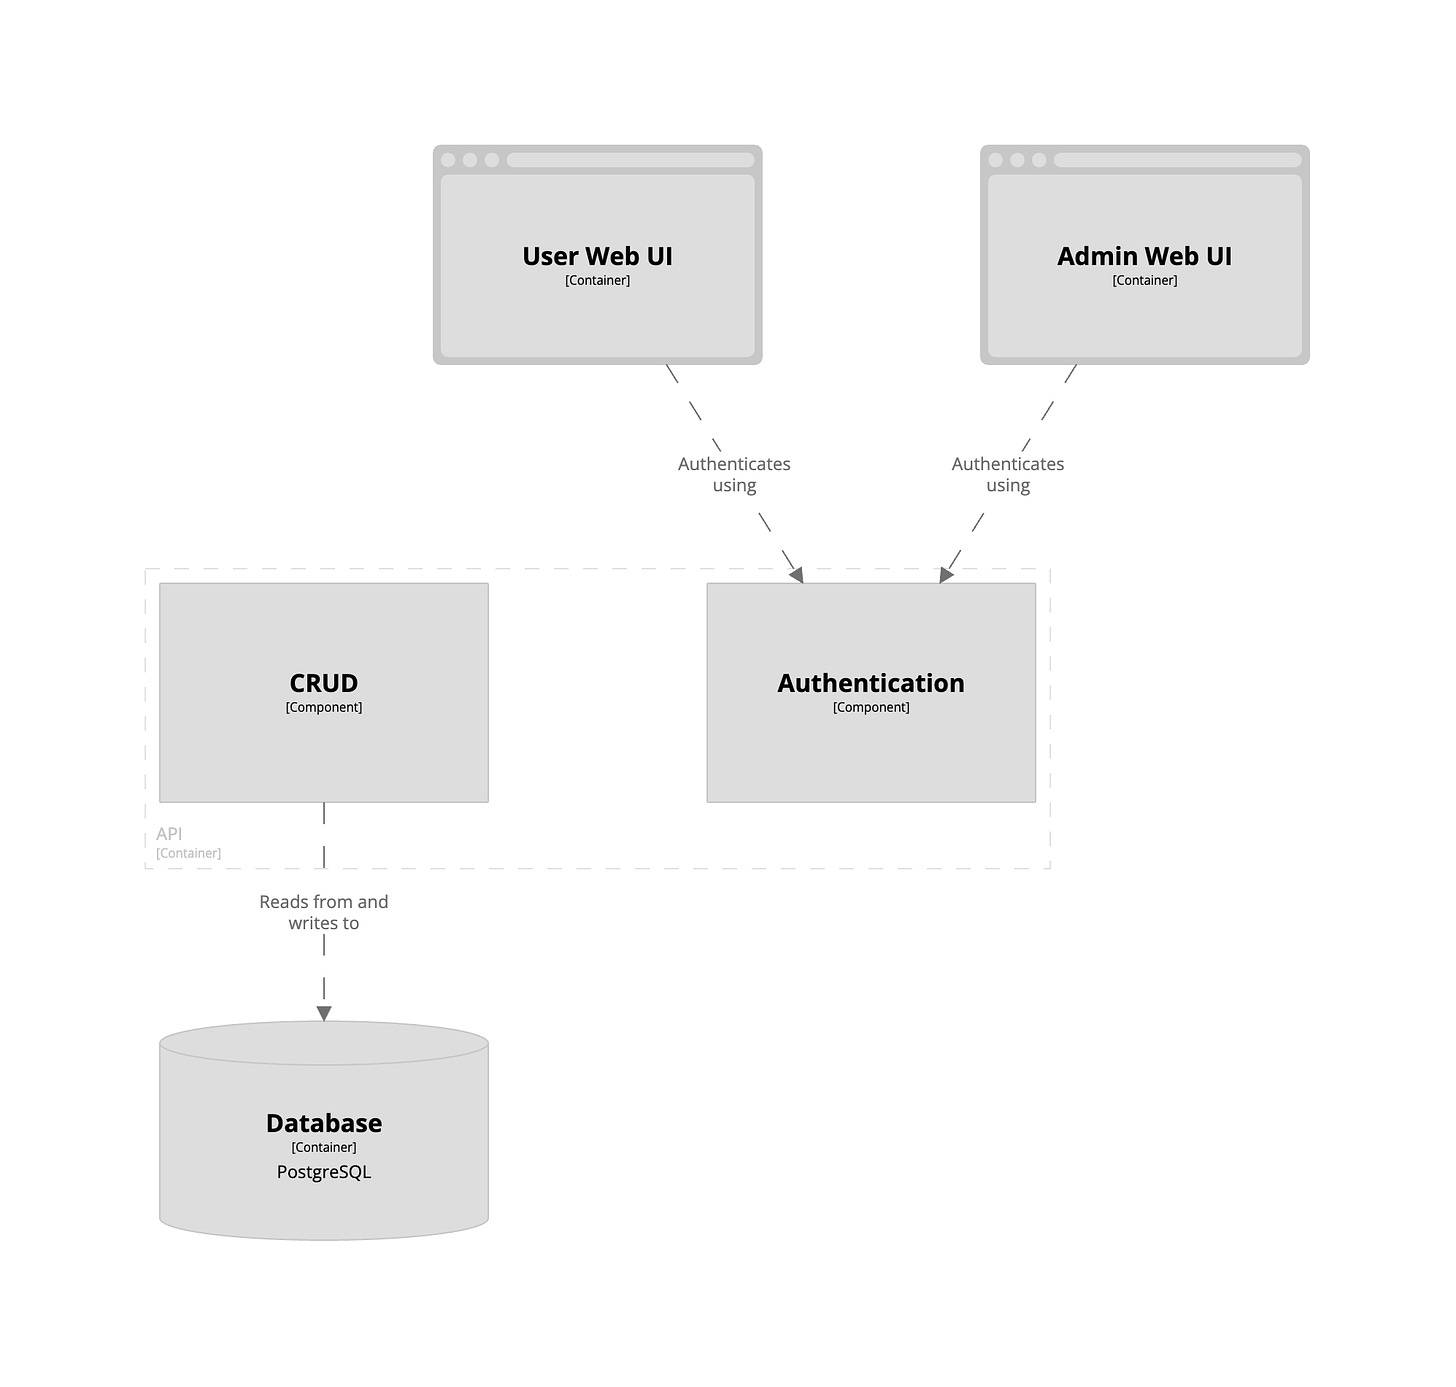
This diagram focuses on the internal structure of the API container within the Task Management Software System. It reveals that the API container houses crucial functionalities like CRUD operations (Create, Read, Update, Delete) for data manipulation and user authentication mechanisms. The CRUD components is the one that talks to the database.
Level 4: Code
The deepest level of zoom is the code diagram. Although this diagram exists, it is often not used as the code paints a very similar picture. However, in highly regulated environments and complex legacy projects this level can help to paint a better picture of inner intricacies of the software.

Supplementary Diagrams
Besides the 4 diagrams above, there are a couple more worth mentioning:
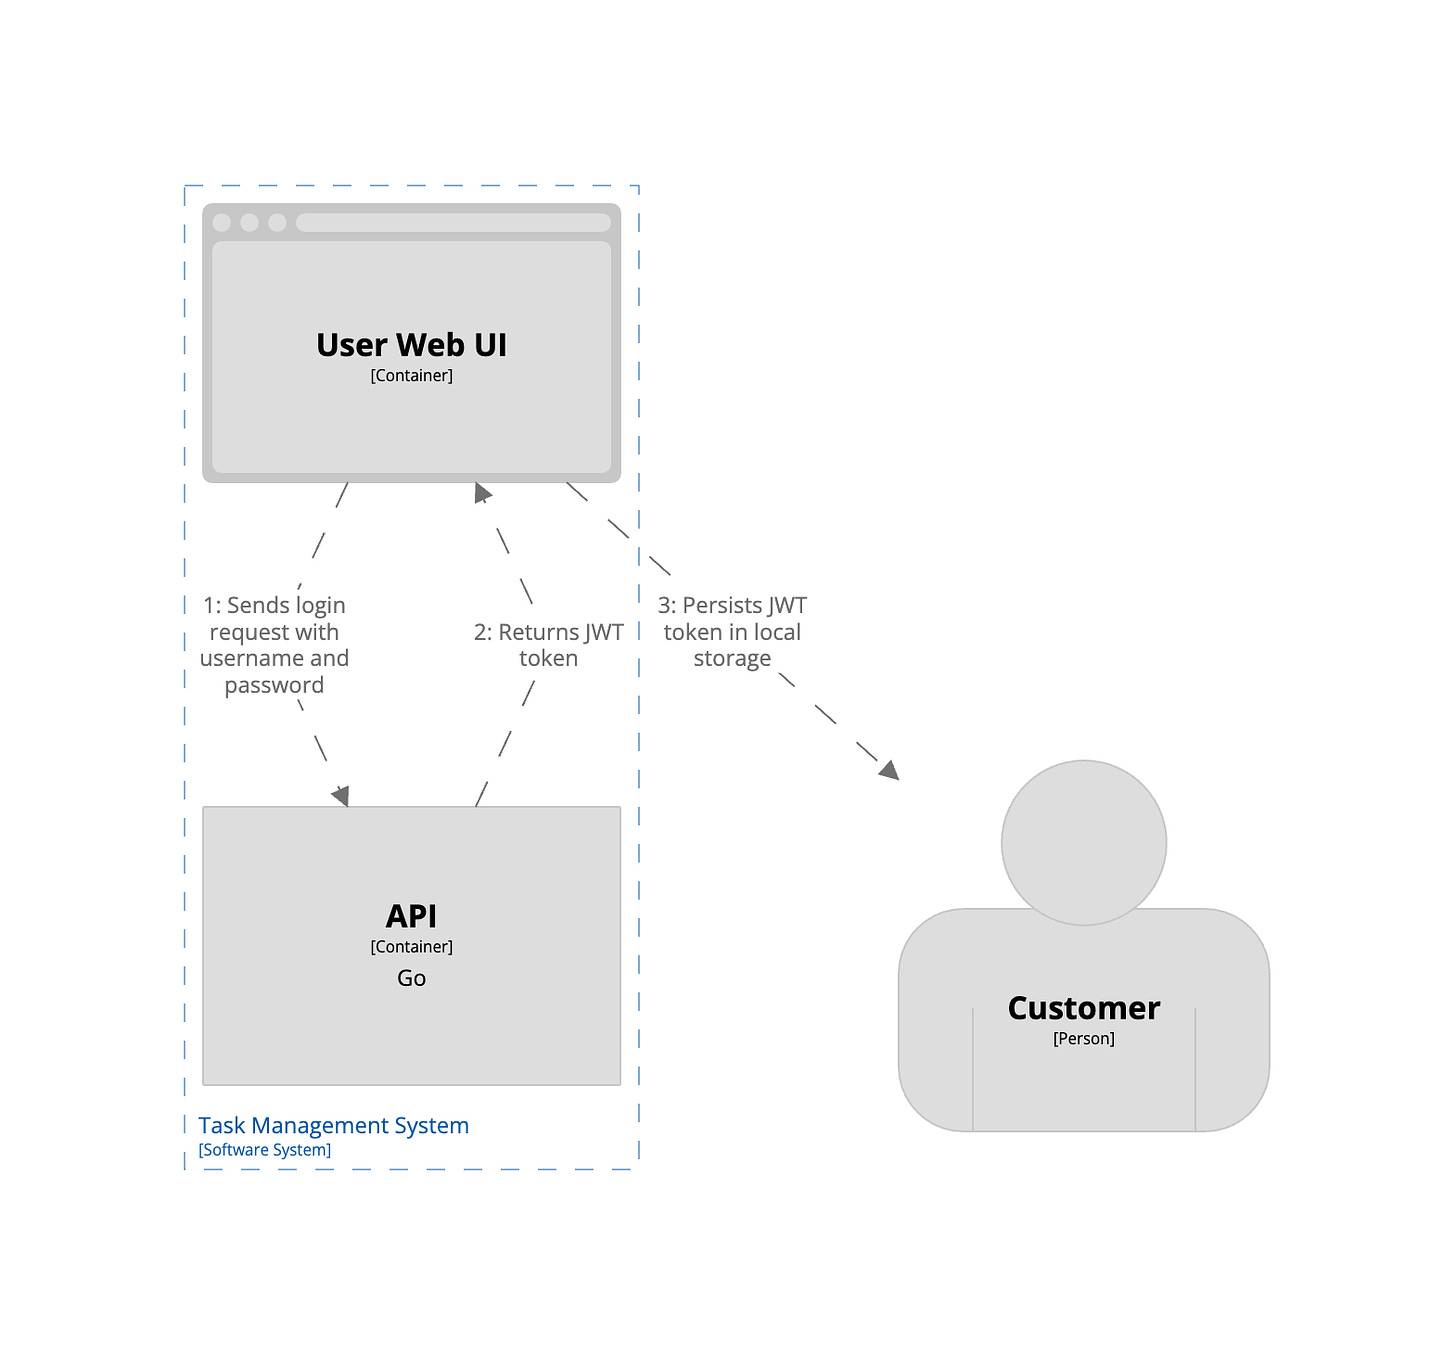
On this diagram we show a Login Flow, which is not a container or component, but rather a software process that happens in our software system. It shows that Web/Admin UIs use JWT-based authentication for communication with the API and the JWT token is stored in local storage on a client side.
Diagrams as Code
The power of C4 comes with a diagram-as-code approach. This means treating your diagrams just like your codebase:
-
Version control: Store them in a source control system (like Git) for easy tracking and collaboration.
-
Collaboration: Work together on diagrams using pull requests, similar to code reviews.
-
Automation: Integrate them into your build pipelines for automatic rendering with your preferred tools.
There are few tools to help with modeling and diagramming, but the most popular nowadays is Structurizr with their custom DSL (Domain Specific Language).
All you need is to get familiar with the DSL syntax, which is pretty simple. As long as you get used to it you will be able to create or update diagrams in no time.
Below you can see the DSL for our Task Management Software System.
workspace { model { customer = person "Customer" "" "person" admin = person "Admin User" "" "person" emailSystem = softwareSystem "Email System" "Mailgun" "external" calendarSystem = softwareSystem "Calendar System" "Calendly" "external" taskManagementSystem = softwareSystem "Task Management System"{ webContainer = container "User Web UI" "" "" "frontend" adminContainer = container "Admin Web UI" "" "" "frontend" dbContainer = container "Database" "PostgreSQL" "" "database" apiContainer = container "API" "Go" { authComp = component "Authentication" crudComp = component "CRUD" } } customer -> webContainer "Manages tasks" admin -> adminContainer "Manages users" apiContainer -> emailSystem "Sends emails" apiContainer -> calendarSystem "Creates tasks in Calendar" webContainer -> apiContainer "Uses" adminContainer -> apiContainer "Uses" apiContainer -> dbContainer "Persists data" crudComp -> dbContainer "Reads from and writes to" webContainer -> authComp "Authenticates using" adminContainer -> authComp "Authenticates using" }}Let’s dive into the most important parts:
workspace [name] [description] { model { }}Here we define our workspace which should have at least one model. A workspace can optionally be given a name and description.
customer = person "Customer" "" "person"admin = person "Admin User" "" "person"In this section we define our persons (for example, a user, actor, role, or persona) in the following format: person <name> [description] [tags].
You can use a similar format (name, description, tags) to identify the external systems:
emailSystem = softwareSystem "Email System" "Mailgun" "external" calendarSystem = softwareSystem "Calendar System" "Calendly" "external"To describe the internal software system we need to write a block that also shows its containers and components:
taskManagementSystem = softwareSystem "Task Management System"{ webContainer = container "User Web UI" "" "" "frontend" adminContainer = container "Admin Web UI" "" "" "frontend" dbContainer = container "Database" "PostgreSQL" "" "database" apiContainer = container "API" "Go" { authComp = component "Authentication" crudComp = component "CRUD" }}The rest of the model is the most interesting part where we define the relationships between all parts (systems, containers, components):
apiContainer -> emailSystem "Sends emails"The following format is used: <identifier> -> <identifier> [description] [technology] [tags].
There are other features available in Structurizr DSL, such as styling, themes, visibility, etc. You can find find them here.
Automate Rendering in Your CI
Since you can host your models on GitHub, it is very easy to automate the pipeline for rendering the diagrams in the tools of your choice.
In our case, Structurizr has a GitHub Action that allows you to run structurizr-cli, a command line utility for Structurizr that lets you create software architecture models based upon the C4 model using a textual domain specific language (DSL).
This sample repository contains a workflow that simply generates a static page and publishes it to GitHub Pages.
name: Deploy static content to Github Pageson: push: branches: ["main"]permissions: contents: read pages: write id-token: writeconcurrency: group: "pages" cancel-in-progress: falsejobs: build: runs-on: ubuntu-latest container: image: ghcr.io/avisi-cloud/structurizr-site-generatr options: --user root steps: - name: Checkout uses: actions/checkout@v3 - name: Create site run: | /opt/structurizr-site-generatr/bin/structurizr-site-generatr generate-site -w diagram.dsl - uses: actions/upload-artifact@v3 with: name: website path: build/site deploy: needs: build environment: name: github-pages url: ${{ steps.deployment.outputs.page_url }} runs-on: ubuntu-latest steps: - uses: actions/download-artifact@v3 with: name: website path: build/site - name: Setup Pages uses: actions/configure-pages@v3 - name: Upload artifact uses: actions/upload-pages-artifact@v1 with: path: "build/site" - name: Deploy to GitHub Pages id: deployment uses: actions/deploy-pages@v2This Github Action uses Structurizr CLI action to compile our DSL file as HTML and publish it to Github Pages.
Conclusion
I believe that creating and maintaining effective and clear diagrams should be effortless. Up-to-date visuals ensure everyone stays on the same page, eliminating confusion and wasted time.
The C4 model and a bit of automation with Structurizr DSL can help make this process faster and keep diagrams close to the codebase. The whole process can now be automated as well into your SDLC.