
包阅导读总结
1. 关键词:Lakehouse Monitoring、Data Quality、Unity Catalog、Expectations、Profiling
2. 总结:本文介绍了 Databricks Lakehouse Monitoring 的通用可用性,强调其在数据和 AI 监测方面的作用,包括自动化分析、定制化、主动预警等,能提升数据和模型质量,建立信任,适用于不同场景,操作简单。
3. 主要内容:
– Lakehouse Monitoring 发布
– 在 Data and AI Summit 宣布通用可用
– 统一监测数据和 AI,基于 Unity Catalog
– 数据和模型质量的重要性
– 高质量数据和模型对业务成功至关重要
– 质量问题常发现太晚影响业务
– Lakehouse Monitoring 功能
– 自动化分析
– 为 Delta Table 生成指标表和漂移指标表
– 为推理表生成模型性能和漂移指标
– 自动生成仪表盘展示趋势和异常
– 可定制化
– 自定义指标
– 设定切片表达式
– 编辑仪表盘
– 主动检测质量问题
– 设置数据质量期望
– 未来将扩展到 Delta 表的更多能力
– 使用 Lakehouse Monitoring
– 前往 Unity Catalog 表的 Quality 标签开始
– 有 3 种分析类型可选
– 大规模监测建议启用 CDF
思维导图:
文章来源:databricks.com
作者:Databricks
发布时间:2024/8/1 16:00
语言:英文
总字数:1233字
预计阅读时间:5分钟
评分:82分
标签:数据质量,Databricks,湖仓监控,AI 监控,数据分析
以下为原文内容
本内容来源于用户推荐转载,旨在分享知识与观点,如有侵权请联系删除 联系邮箱 media@ilingban.com
At Data and AI Summit, we announced the general availability of Databricks Lakehouse Monitoring. Our unified approach to monitoring data and AI allows you to easily profile, diagnose, and enforce quality directly in the Databricks Data Intelligence Platform. Built directly on Unity Catalog, Lakehouse Monitoring (AWS | Azure) requires no additional tools or complexity. By discovering quality issues before downstream processes are impacted, your organization can democratize access and restore trust in your data.
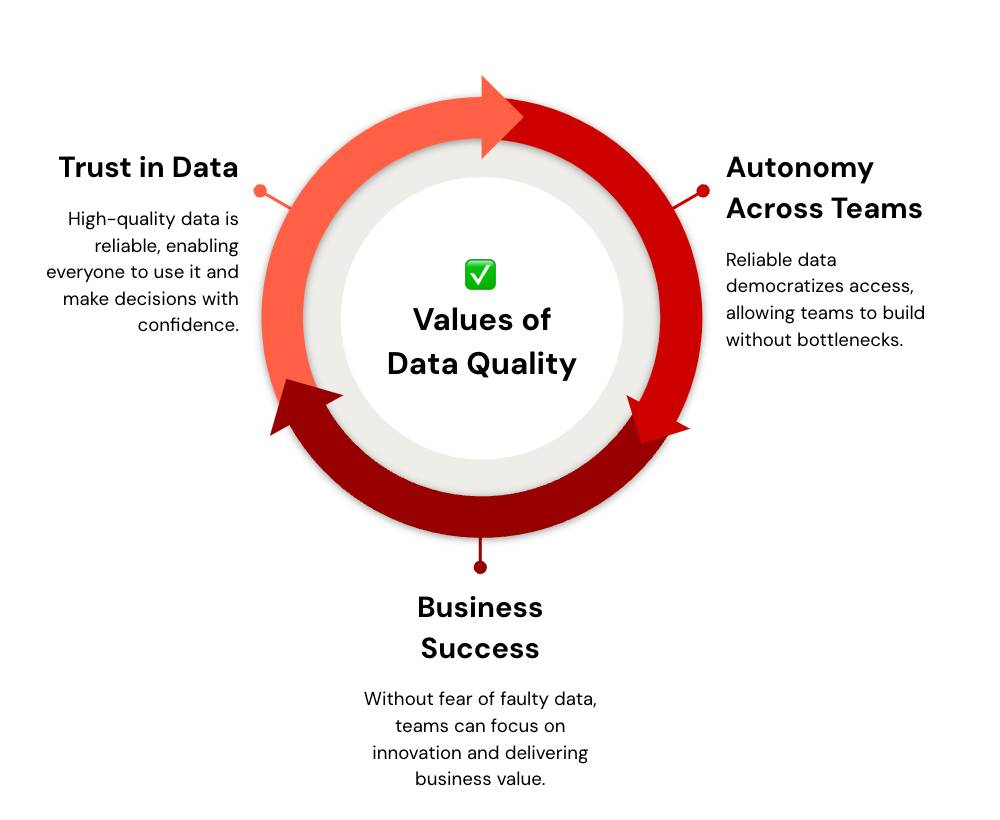
Why Data and Model Quality Matters
In today’s data-driven world, high-quality data and models are essential for building trust, creating autonomy, and driving business success. Yet, quality issues often go unnoticed until it’s too late.
Does this scenario sound familiar? Your pipeline seems to be running smoothly until a data analyst escalates that the downstream data is corrupted. Or for machine learning, you don’t realize your model needs retraining until performance issues become glaringly obvious in production. Now your team is faced with weeks of debugging and rolling back changes! This operational overhead not only slows down the delivery of core business needs but also raises concerns that critical decisions may have been made on faulty data. To prevent these issues, organizations need a quality monitoring solution.
With Lakehouse Monitoring, it’s easy to get started and scale quality across your data and AI. Lakehouse Monitoring is built on Unity Catalog so teams can track quality alongside governance, without the hassle of integrating disparate tools. Here’s what your organization can achieve with quality directly in the Databricks Data Intelligence Platform:
Learn how Lakehouse Monitoring can improve the reliability of your data and AI, while building trust, autonomy, and business value in your organization.
Unlock Insights with Automated Profiling
Lakehouse Monitoring offers automated profiling for any Delta Table (AWS | Azure) in Unity Catalog out-of-the-box. It creates two metric tables (AWS | Azure) in your account—one for profile metrics and another for drift metrics. For Inference Tables (AWS | Azure), representing model inputs and outputs, you’ll also get model performance and drift metrics. As a table-centric solution, Lakehouse Monitoring makes it simple and scalable to monitor the quality of your entire data and AI estate.
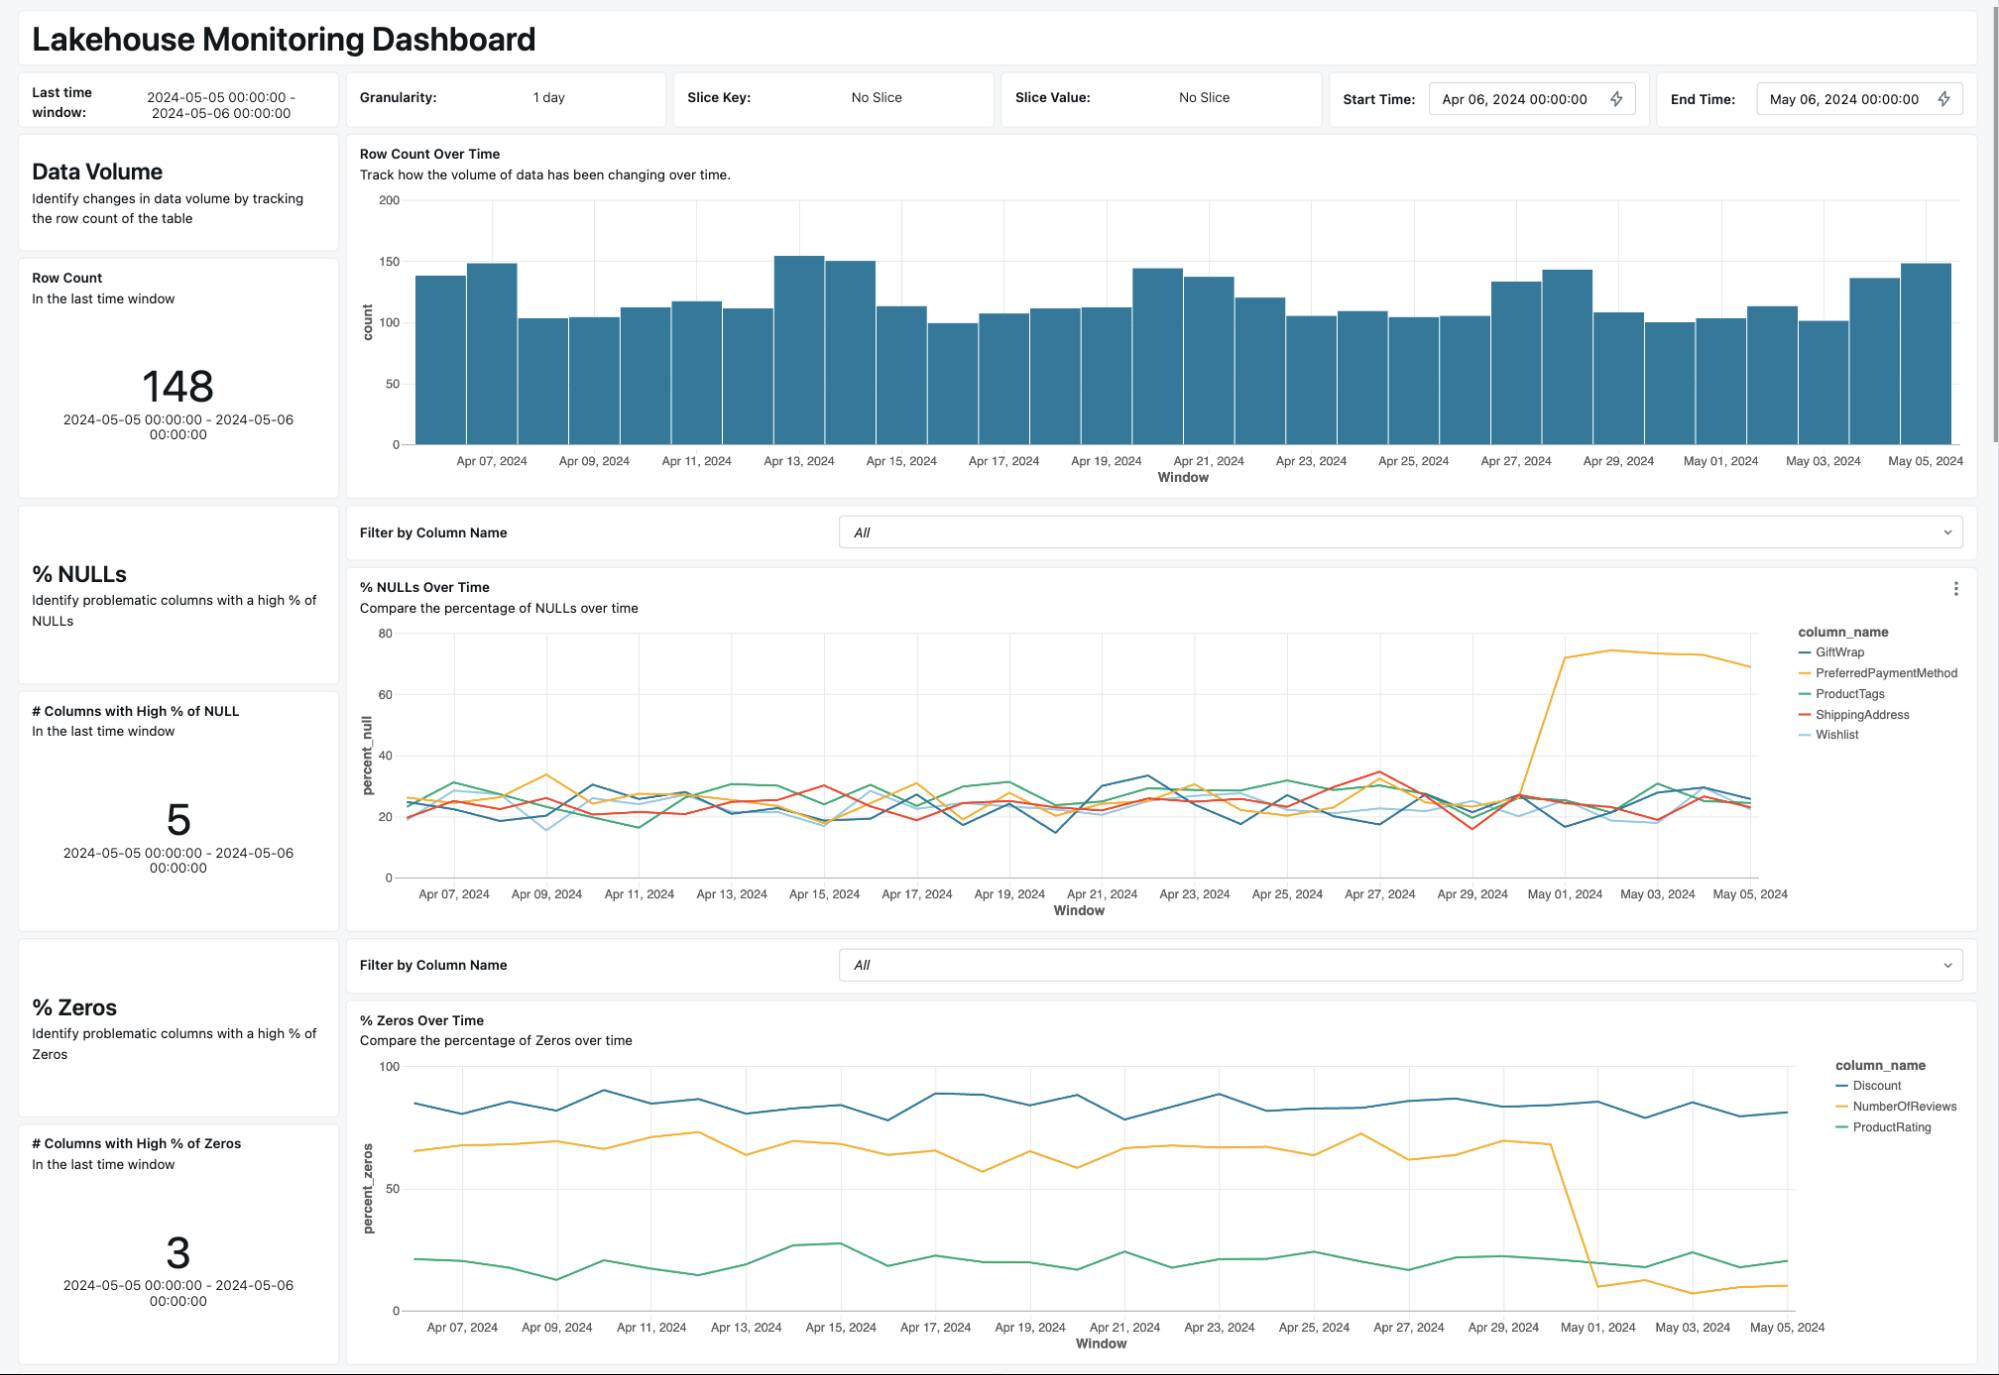
Leveraging the computed metrics, Lakehouse Monitoring automatically generates a dashboard plotting trends and anomalies over time. By visualizing key metrics such as count, percent nulls, numerical distribution change, and categorical distribution change over time, Lakehouse Monitoring delivers insights and identifies problematic columns. If you’re monitoring a ML model, you can track metrics like accuracy, F1, precision, and recall to identify when the model needs retraining. With Lakehouse Monitoring, quality issues are uncovered without hassle, ensuring your data and models remain reliable and effective.
“Lakehouse Monitoring has been a game changer. It helps us solve the issue of data quality directly in the platform… it’s like the heartbeat of the system. Our data scientists are excited they can finally understand data quality without having to jump through hoops.”– Yannis Katsanos, Director of Data Science, Operations and Innovation at Ecolab
Lakehouse Monitoring is fully customizable to suit your business needs. Here’s how you can tailor it further to fit your use case:
- Custom metrics (AWS | Azure): In addition to the built-in metrics, you can write SQL expressions as custom metrics that we’ll compute with the monitor refresh. All metrics are stored in Delta tables so you can easily query and join metrics with any other table in your account for deeper analysis.
- Slicing Expressions (AWS | Azure): You can set slicing expressions to monitor subsets of your table in addition to the table as a whole. You can slice on any column to view metrics grouped by specific categories, e.g. revenue grouped by product line, fairness and bias metrics sliced by ethnicity or gender, etc.
- Edit the Dashboard (AWS | Azure): Since the autogenerated dashboard is built with Lakeview Dashboards (AWS | Azure), this means you can leverage all Lakeview capabilities, including custom visualizations and collaboration across workspaces, teams, and stakeholders.
Next, Lakehouse Monitoring further ensures data and model quality by shifting from reactive processes to proactive alerting. With our new Expectations feature, you’ll get notified of quality issues as they arise.
Proactively Detect Quality Issues with Expectations
Databricks brings quality closer to your data execution, allowing you to detect, prevent and resolve issues directly within your pipelines.
Today, you can set data quality Expectations (AWS | Azure) on materialized views and streaming tables to enforce row-level constraints, such as dropping null records. Expectations allow you to surface issues ahead of time so you can take action before it impacts downstream consumers. We plan to unify expectations in Databricks, allowing you to set quality rules across any table in Unity Catalog—including Delta Tables (AWS | Azure), Streaming Tables (AWS | Azure), and Materialized Views (AWS | Azure). This will help prevent common problems like duplicates, high percentages of null values, distributional changes in your data, and will indicate when your model needs retraining.
To extend expectations to Delta tables, we’re adding the following capabilities in the coming months:
- *In Private Preview* Aggregate Expectations: Define expectations for primary keys, foreign keys, and aggregate constraints such as percent_null or count.
- Notifications: Proactively address quality issues by getting alerted or failing a job upon quality violation.
- Observability: Integrate green/red health indicators into Unity Catalog to signal whether data meets quality expectations. This allows anyone to visit the schema page to assess data quality easily. You can quickly identify which tables need attention, enabling stakeholders to determine if the data is safe to use.
- Intelligent forecasting: Receive recommended thresholds for your expectations to minimize noisy alerts and reduce uncertainty.

Don’t miss out on what’s to come and join our Preview by following this link.
Get started with Lakehouse Monitoring
To get started with Lakehouse Monitoring, simply head to the Quality tab of any table in Unity Catalog and click “Get Started”. There are 3 profile types (AWS | Azure) to choose from:
- Time series: Quality metrics are aggregated over time windows so you get metrics grouped by day, hour, week, etc.
- Snapshot: Quality metrics are calculated over the full table. This means that everytime metrics are refreshed, they’re recalculated over the whole table.
- Inference: In addition to data quality metrics, model performance and drift metrics are computed. You can compare these metrics over time or optionally with baseline or ground-truth labels.
💡Best practices tip: To monitor at scale, we recommend enabling Change Data Feed (CDF) (AWS | Azure) on your table. This gives you incremental processing which means we only process the newly appended data to the table rather than re-processing the entire table every refresh. As a result, execution is more efficient and helps you save on costs as you scale monitoring across many tables. Note that this feature is only available for Time series or Inference Profiles since Snapshot requires a full scan of the table everytime the monitor is refreshed.
To learn more or try out Lakehouse Monitoring for yourself, check out our product links below:
By monitoring, enforcing, and democratizing data quality, we’re empowering teams to establish trust and create autonomy with their data. Bring the same reliability to your organization and get started with Databricks Lakehouse Monitoring (AWS | Azure) today.