
包阅导读总结
1. 关键词:Grafana、EC2、监控、设置、数据可视化
2. 总结:本文介绍了在亚马逊 EC2 上设置 Grafana 的详细步骤,包括配置 EC2 实例的入站规则、创建 IAM 角色、下载安装 Grafana、连接数据源到 Grafana 仪表盘以及创建仪表盘,旨在帮助读者实现高效的系统监控和数据可视化。
3. 主要内容:
– 简介
– Grafana 是开源的分析和监控平台,与 EC2 结合可创建稳定监控环境。
– 准备工作
– 目标受众包括云新手和 DevOps 专家。
– 配置 EC2 实例
– 配置入站规则以访问 3000 端口。
– 建立 EC2 实例并设置网络入站规则。
– 创建 IAM 角色
– 为登录 Grafana 服务生成凭证。
– 下载 Grafana
– 通过命令行下载并启用服务。
– 确认服务在 3000 端口运行。
– 设置 Grafana 仪表盘
– 登录,默认用户名和密码为 admin。
– 连接到 AWS 云监控服务,创建访问密钥。
– 导入 EC2 仪表盘以监控实例性能。
– 总结
– 希望指南有助于设置高效的仪表盘。
思维导图: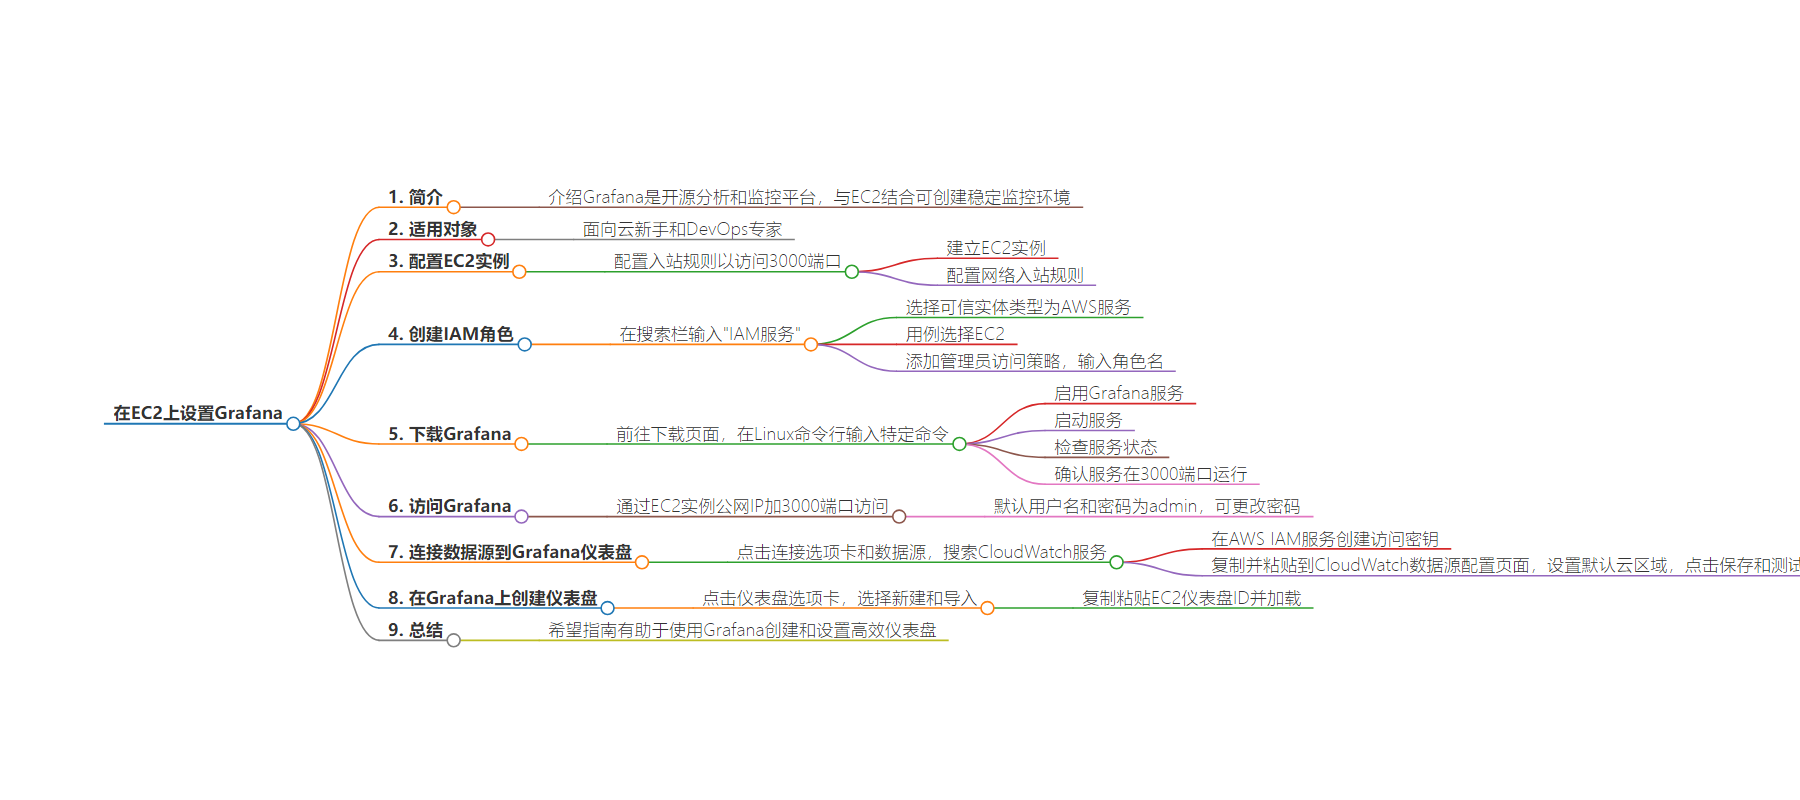
文章地址:https://www.freecodecamp.org/news/how-to-set-up-grafana-on-ec2/
文章来源:freecodecamp.org
作者:Onwubiko Emmanuel Ebere
发布时间:2024/8/2 13:42
语言:英文
总字数:1117字
预计阅读时间:5分钟
评分:83分
标签:格拉法纳,Amazon EC2,监控,DevOps,数据可视化
以下为原文内容
本内容来源于用户推荐转载,旨在分享知识与观点,如有侵权请联系删除 联系邮箱 media@ilingban.com
In today’s data-driven world, it’s important to monitor and visualize system metrics to make sure everything works consistently and performs well.
Grafana is an open-source analytics and monitoring platform. It has gained widespread recognition among developers and enterprises looking to extract more insights from the data produced by their systems.
Grafana has many powerful visualization features, and when combined with Amazon EC2’s scalability and flexibility, it creates a stable environment for efficient monitoring.
This article will walk you through setting up Grafana on Amazon EC2 and creating informative dashboards out of raw data.
For Whom is this Intended?
This tutorial is intended for both novices to the cloud and experts in DevOps. The goal of this post is to make the installation process easier so you can use Grafana on AWS to its fullest. Now let’s get going.
How to Configure Your EC2 Instance
You need to configure the inbound rule for your EC2 instance to access port 3000, as Grafana operates on this port. But first, you need to establish an EC2 instance. You can follow this guide on how to set up your AWS EC2 instance. It takes less than 5 minutes.
Once you have created your EC2 instance, you’ll need to configure the network inbound rules. So head to your instance page and click on it. On the button widget, click on the security tab and click on the security group link (it should look like this: “sg-547**”).
Once you open the page in the inbound rules section, click on ‘Edit inbound rules’. Click on Add a new rule and add 3000 to the port range field, and on the source field, select 0.0.0.0/0. Then save.
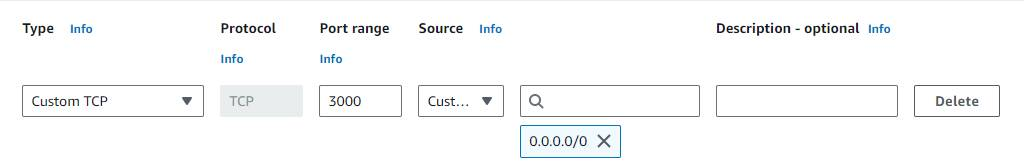 Inbound rules
How to Create an IAM Role
Now you need to construct an IAM (Identity Access Management) role. You’re developing an identity role so that you can generate credentials that you’ll subsequently use to log in to your Grafana service.
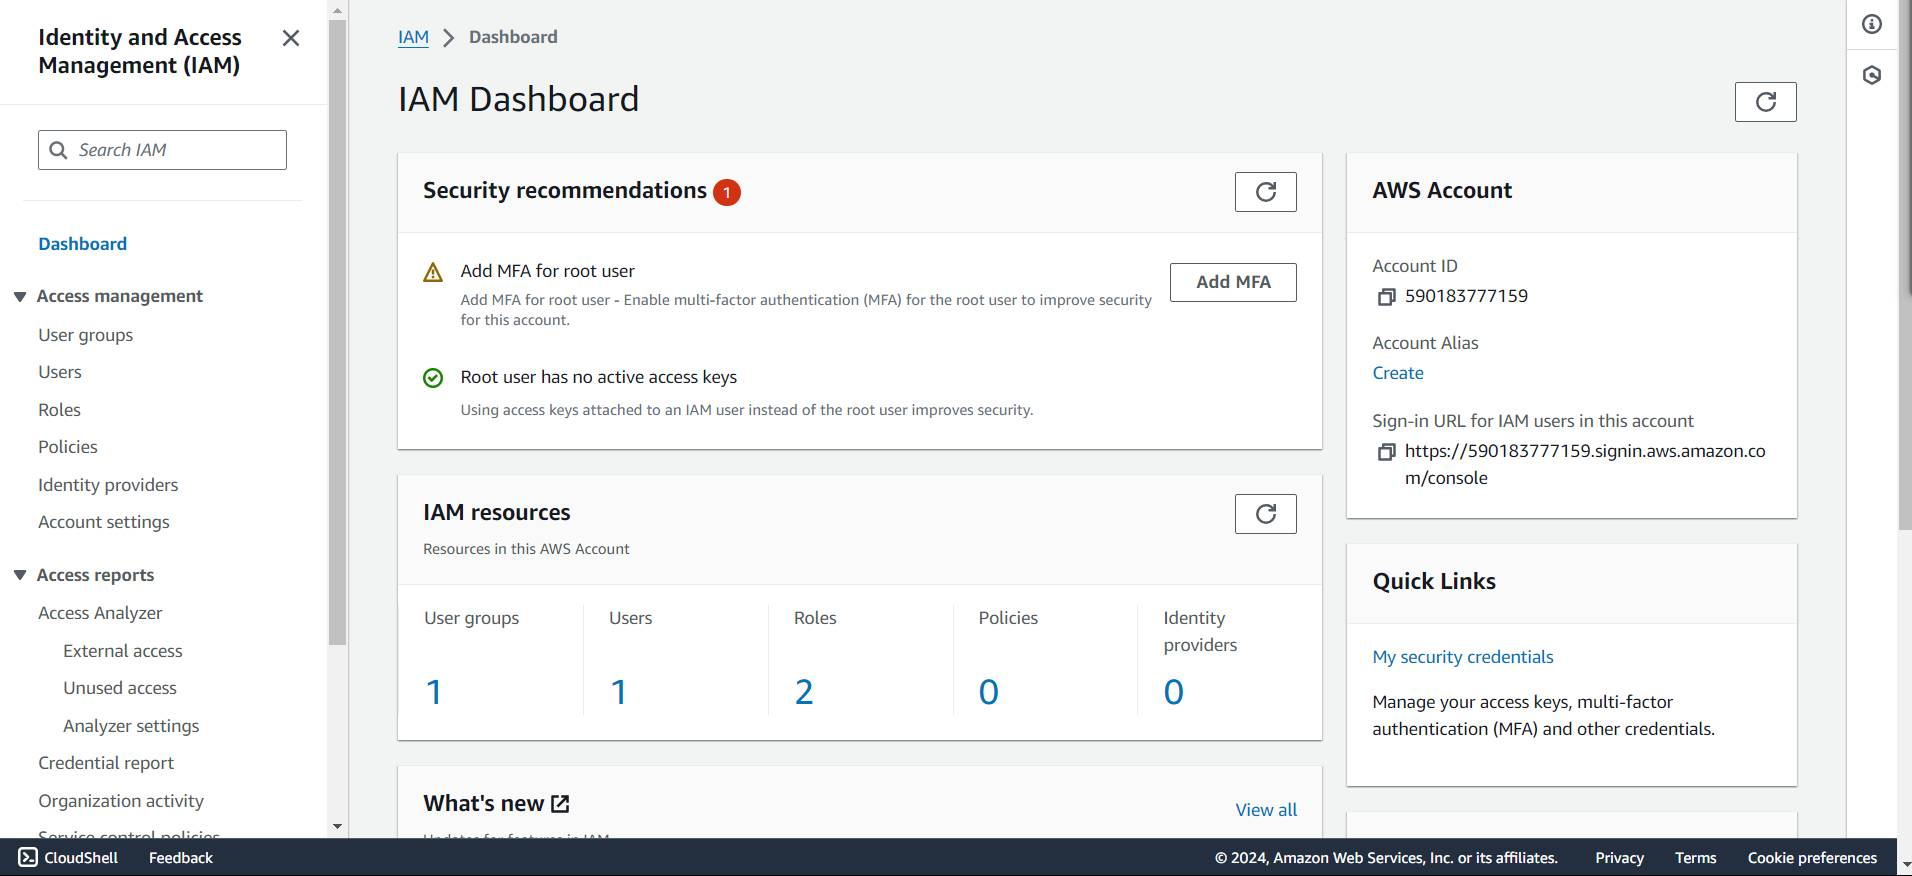 IAM Dashboard
So, in the search field, type “IAM service” and click it. Click ‘Create role‘, and select the AWS service as the trusted entity type.
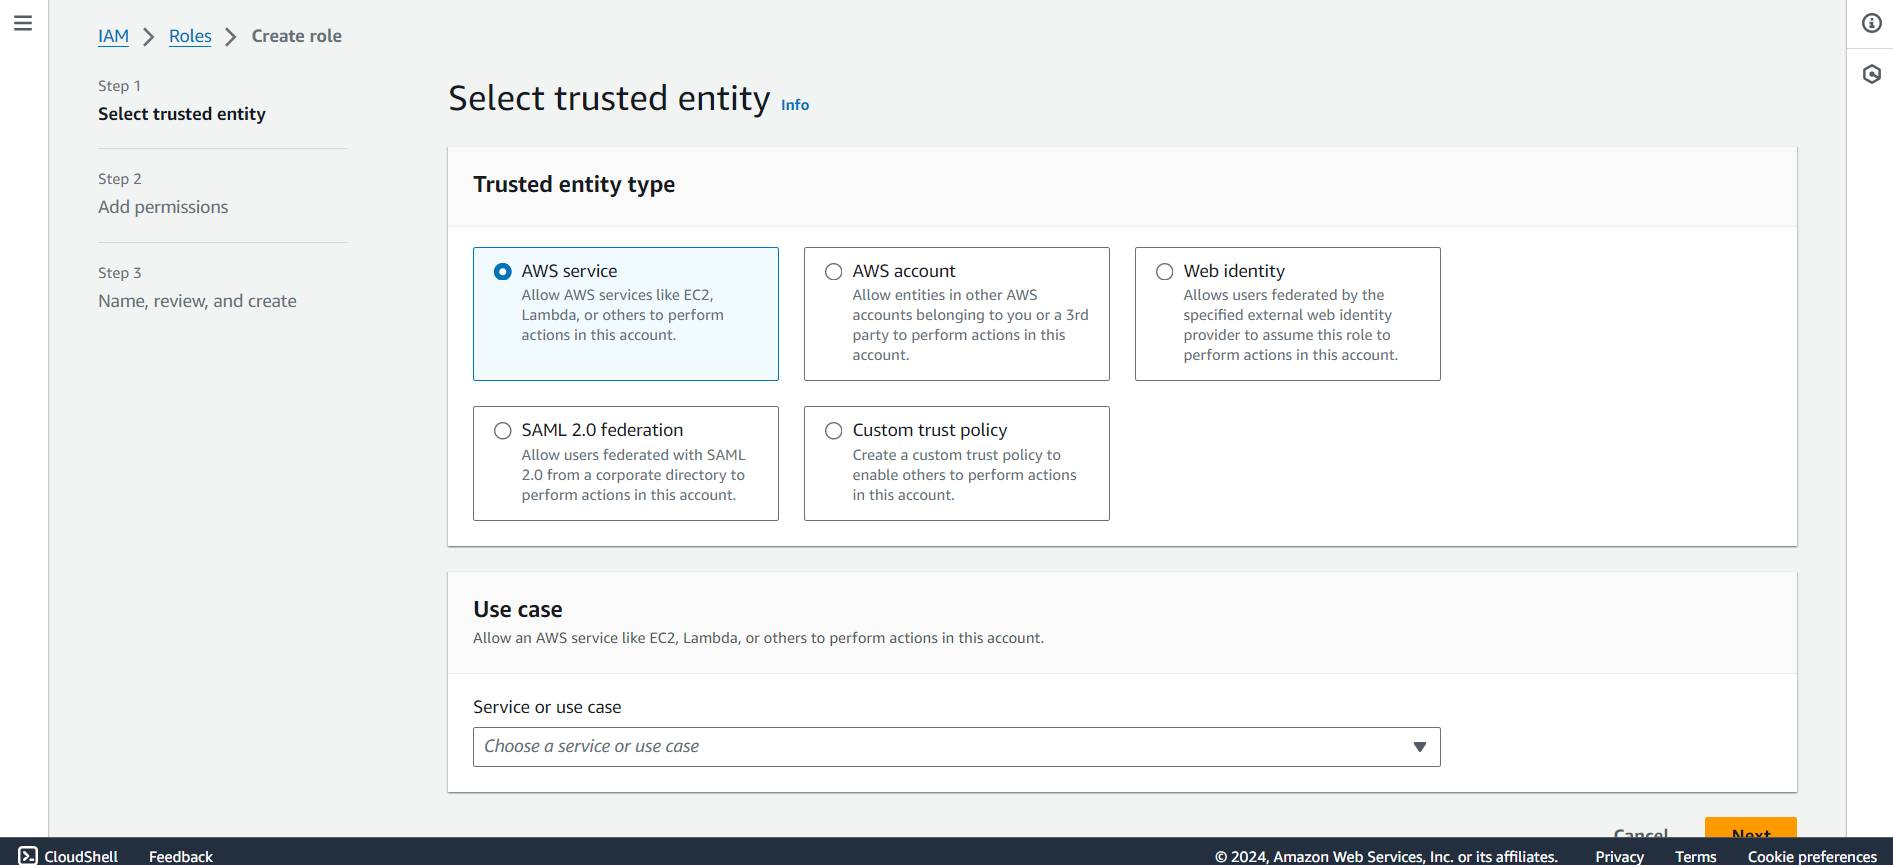 IAM Trusted Entity
On the use case section, select EC2, then click next.
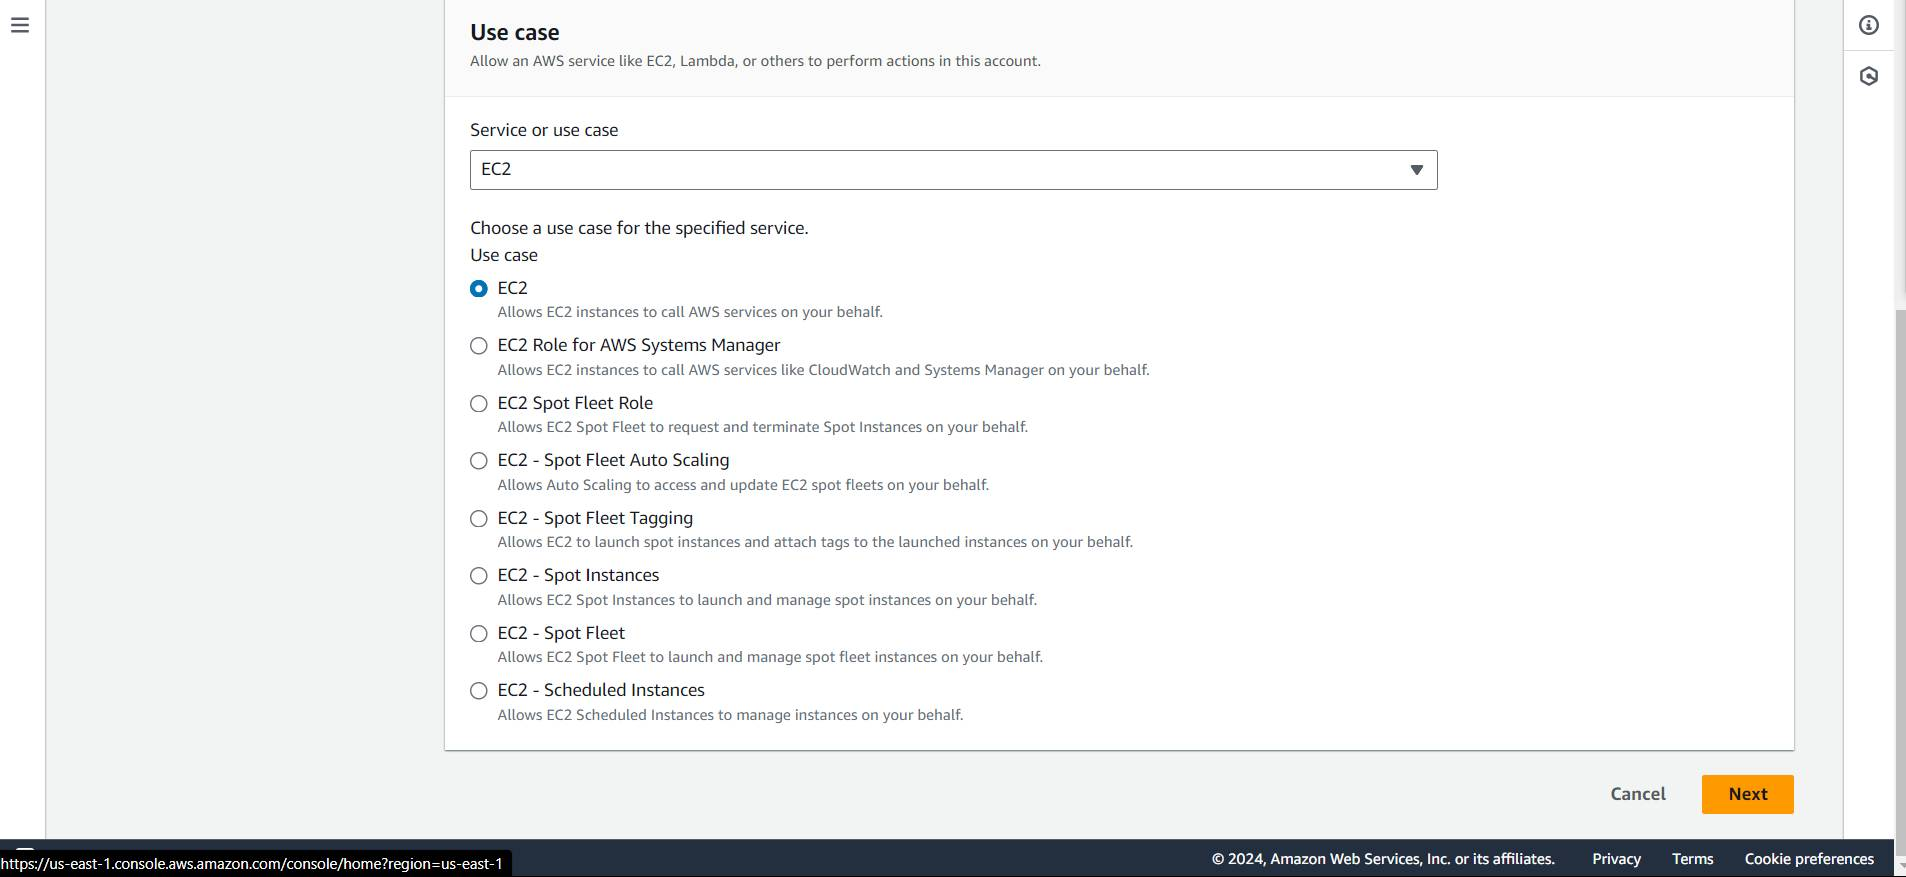 IAM role use case
On the Add Permissions page, click on the AdministratorAccess policy, then click next. Enter a role name – in this case, I used Grafana-Server-Role.
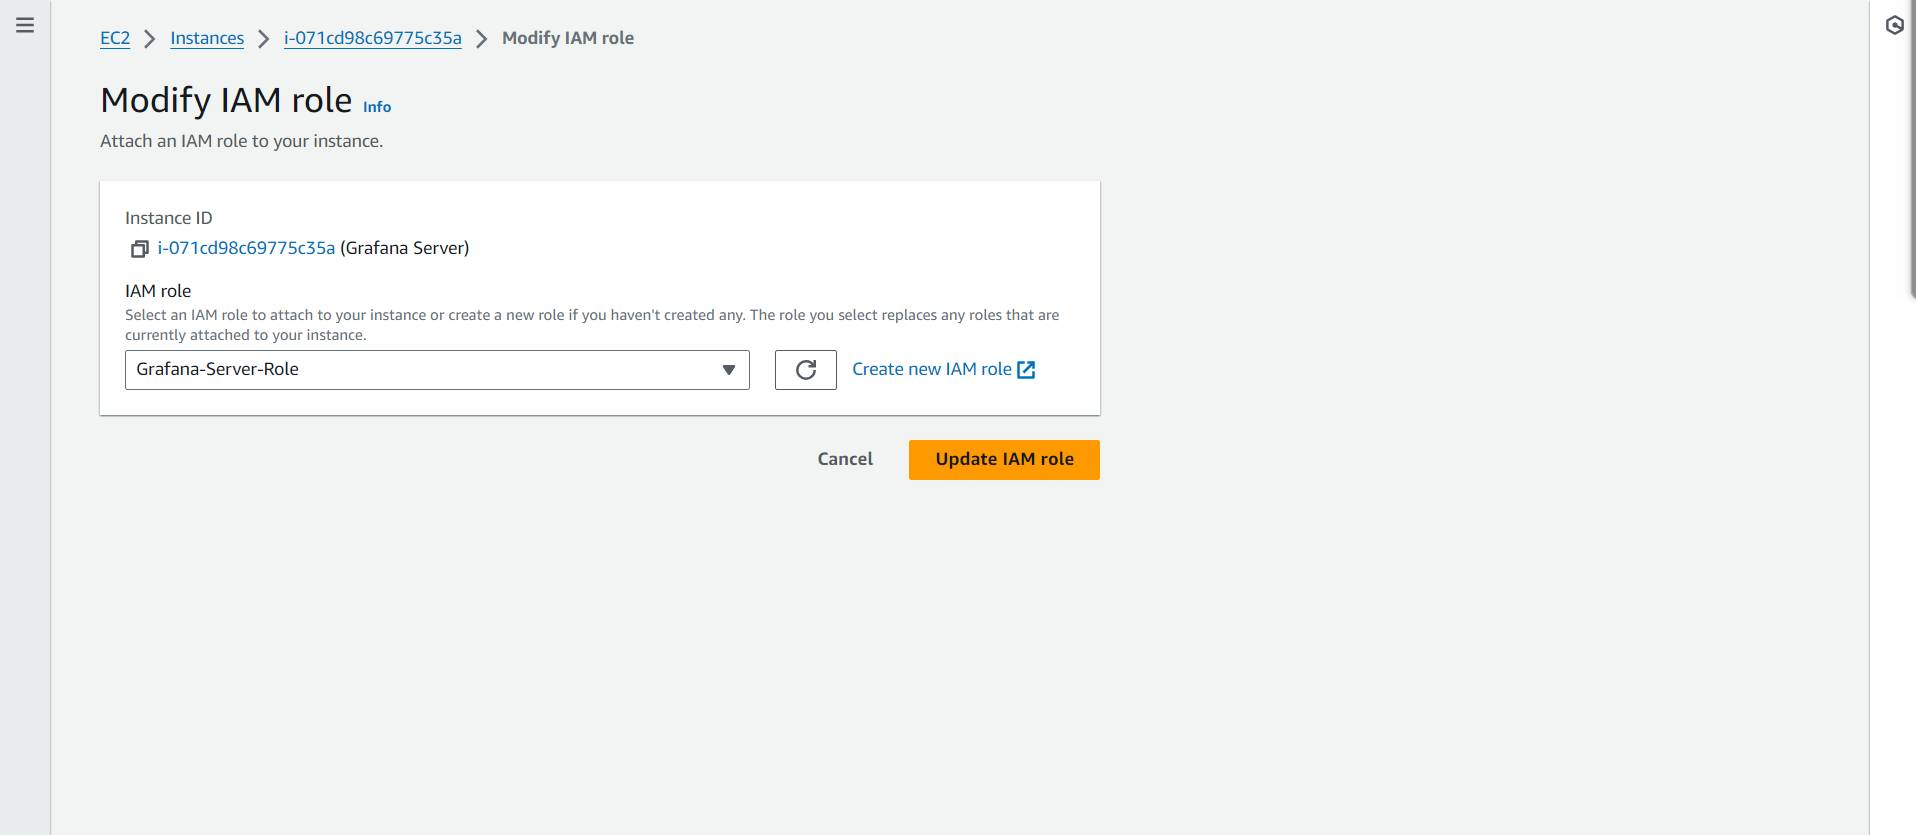 Role creation
How to Download Grafana
Now that you’ve configured your EC2 inbound rule and also configured the IAM role, let’s set up Grafana on your EC2 instance.
So head over to Grafana’s download page. Since we’ll be downloading the version for Amazon Linux in this tutorial, you need to type in the following command on your Linux command line. Note: You need to connect to your VM instance through SSH (Secure Shell). In this case, I am using the EC2 Instance Connect.
sudo yum install -y https://dl.grafana.com/enterprise/release/grafana-enterprise-11.1.0-1.x86_64.rpmNow you’ll enable the Grafana service on your terminal by typing the following command:
systemctl enable grafana-server.serviceThen start the service:
systemctl start grafana-server.serviceCheck the status of the Grafana service on the EC2 instance by running this command:
systemctl status grafana-server.service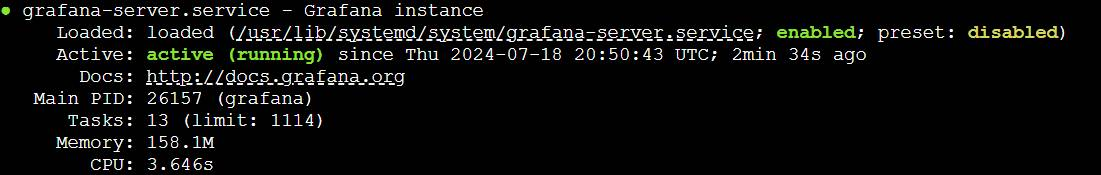 Grafana Service Status
Now that you’ve confirmed that the service is currently active, you’ll also need to check if the Grafana service is active on port 3000, as you’ve already created an inbound rule to cater for this.
You can do this by typing the following command:
netstat -tunpl | grep grafana Port 3000 confirmation
Now that you’ve confirmed that the service runs on port 3000, you can go ahead and set up your Grafana dashboard.
You can access the Grafana dashboard by typing the Public IP of your EC2 instance and adding port 3000 on your web browser, something like this: 34.239.101.172:3000.
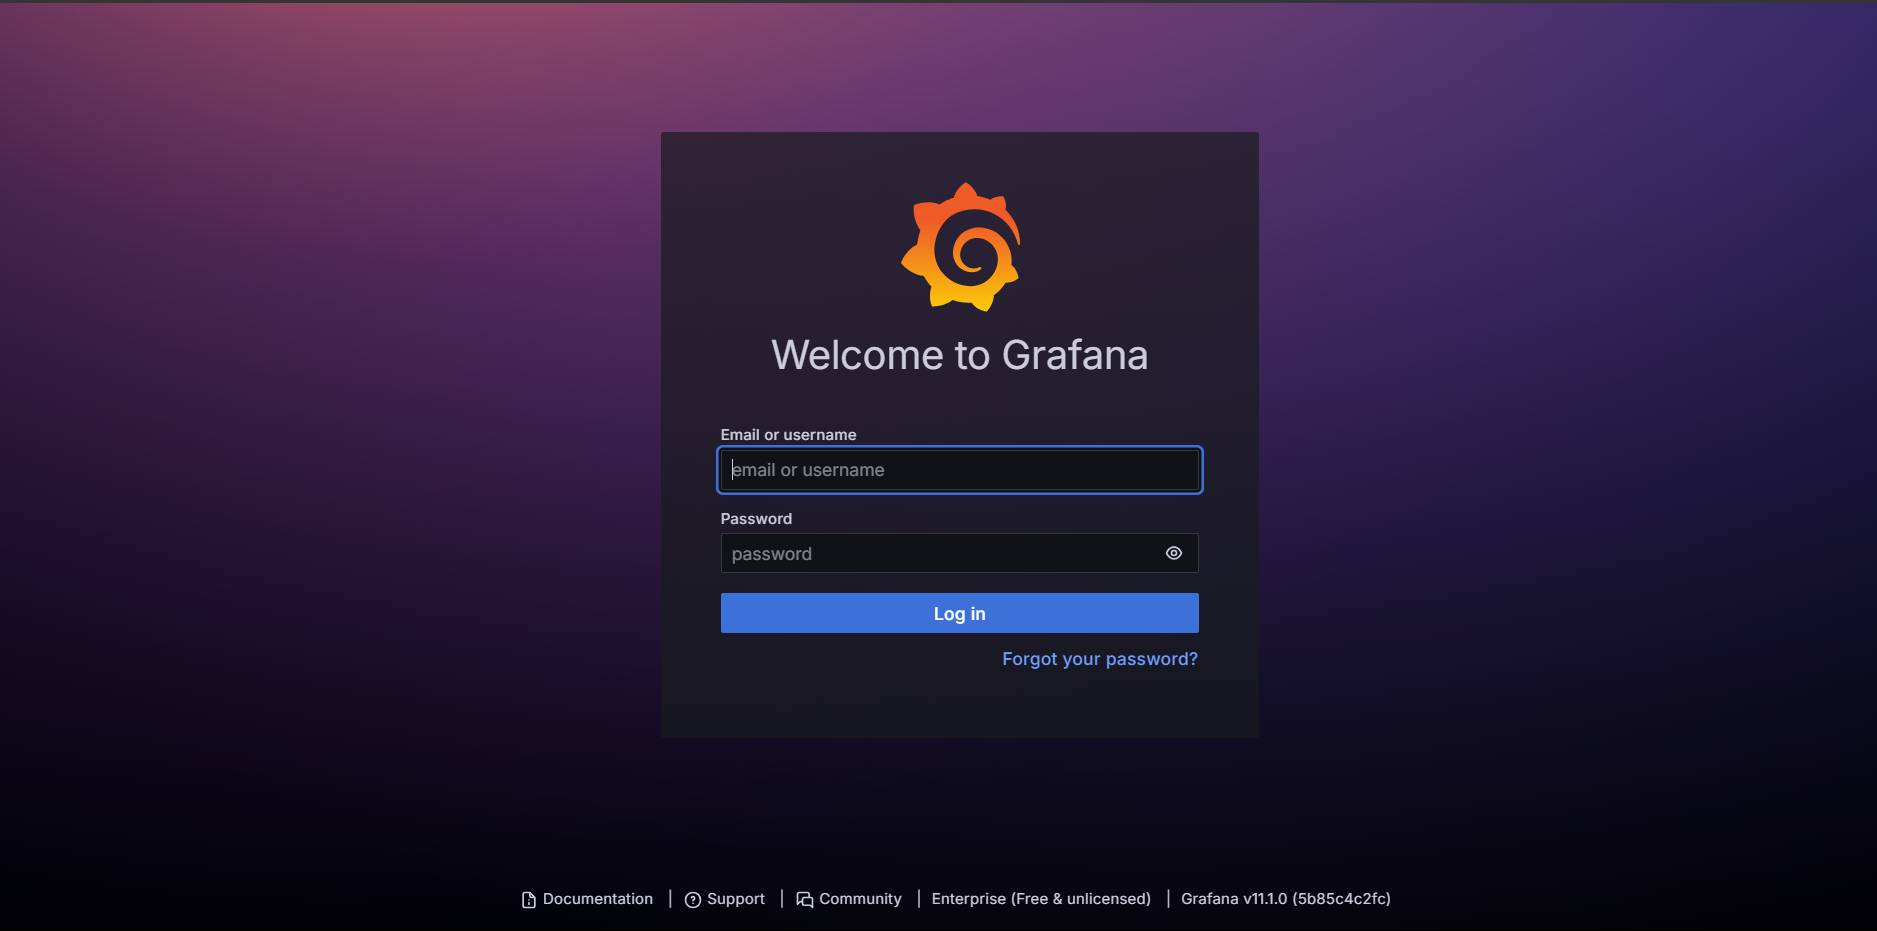 Grafana Login
The default username and password for Grafana are admin, but you’ll be given the option to change your password after you sign in with the default credentials. You can also skip the password change process if you like.
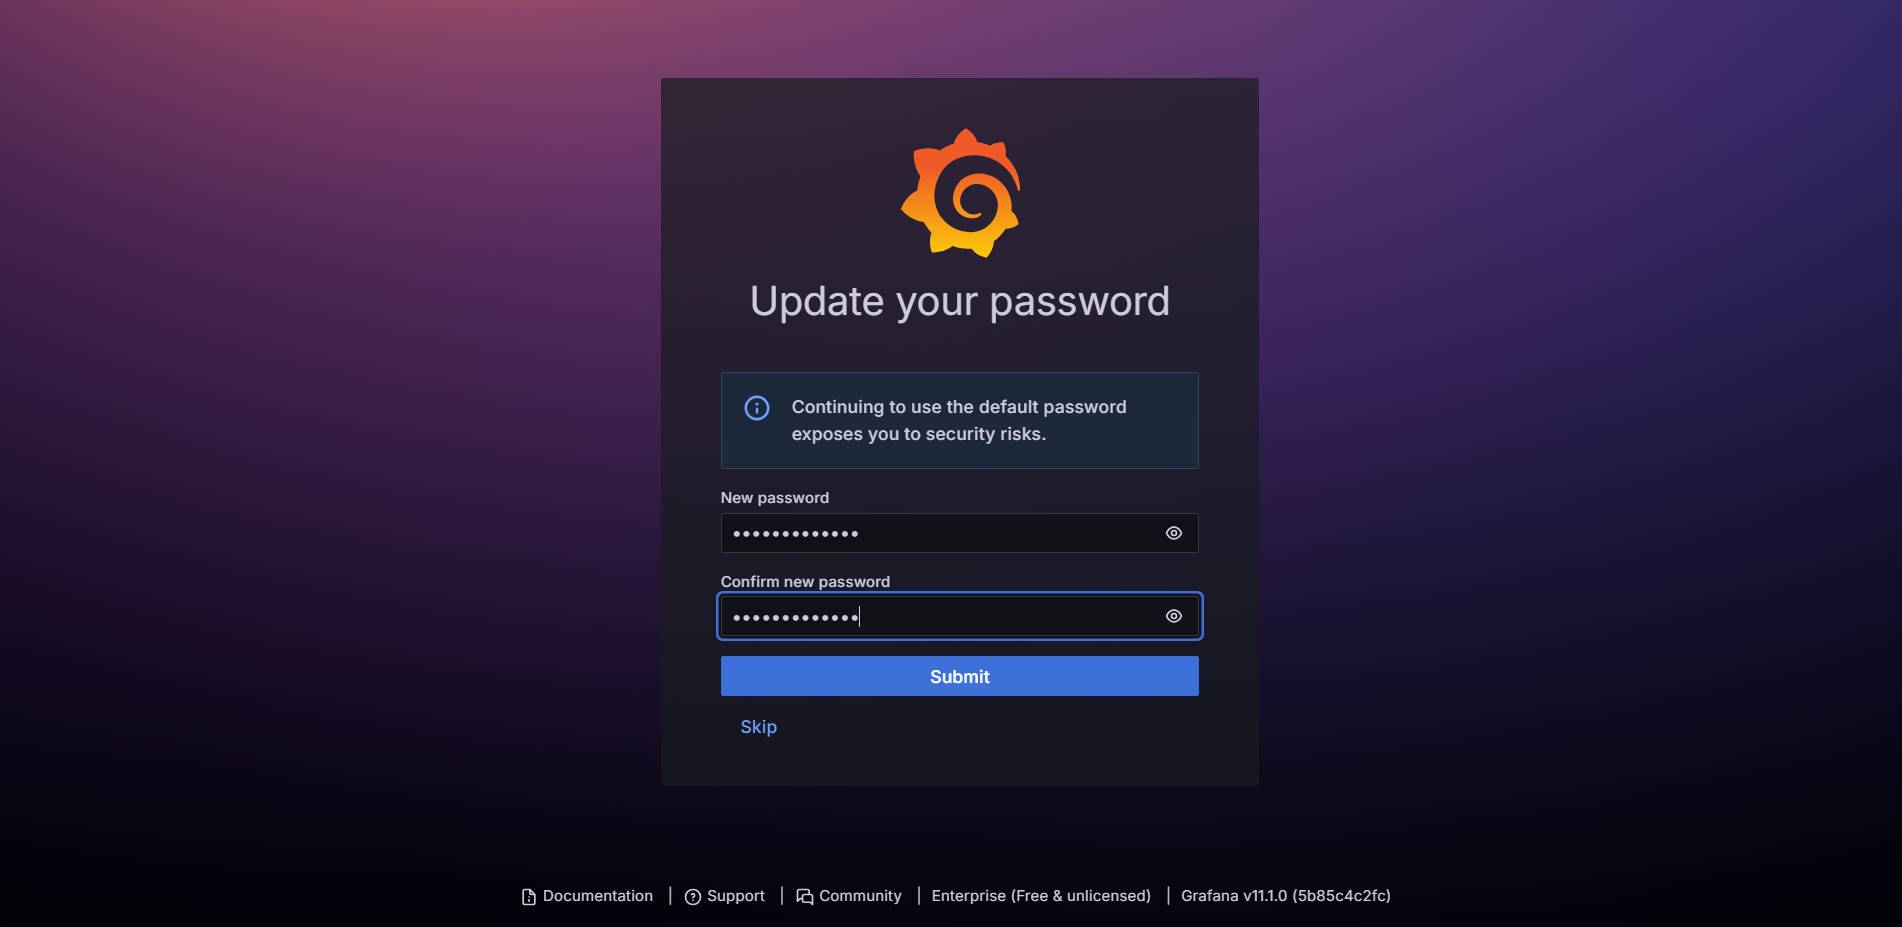 Change password on Grafana
After this step, go to the home page. The next thing to do is to start connecting your Grafana dashboard to a data source. In this case, you’re going to connect it to the AWS cloud watch service.
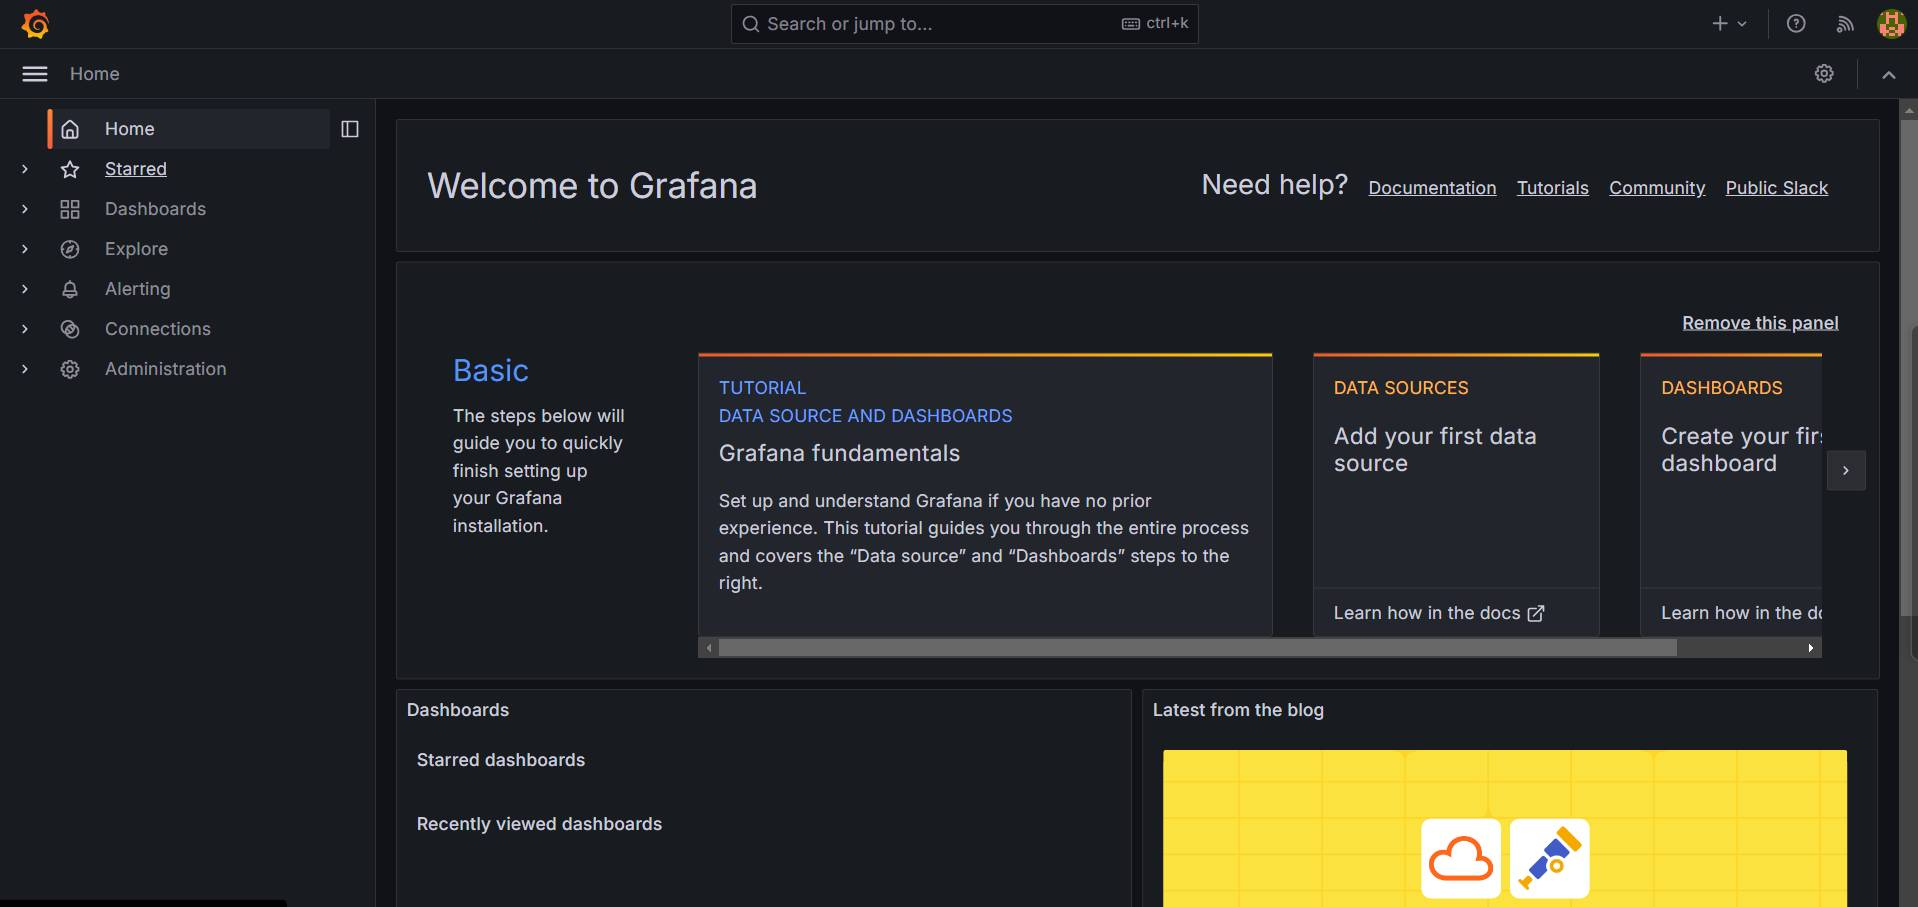 Grafana
How to Connect Data Sources to the Grafana Dashboard
Click on the connections tab on the side menu and click on data sources. Search for the CloudWatch service.
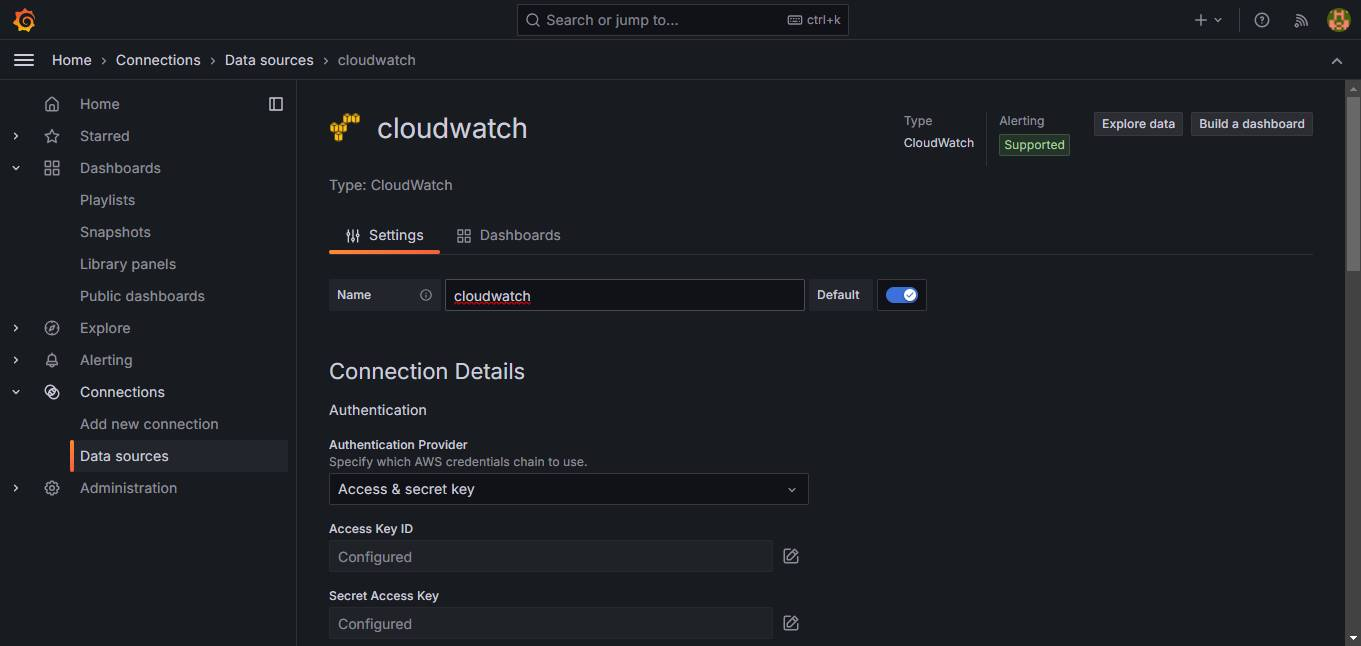 Cloudwatch configuration
Now you’ll be prompted to input your access key ID and secret access key. You will need to create this on your AWS IAM service.
So go back to your IAM management dashboard and go to the user’s tab. If you haven’t created an IAM user, you can do so by checking out this IAM user creation tutorial.
In the user IAM dashboard, scroll down to the access keys section and click on Create access key.
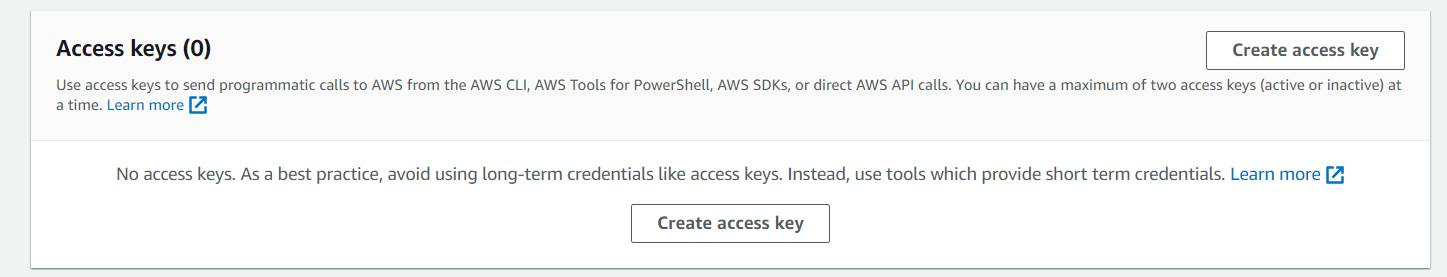 Access key
Select the Command Line Interface use case.
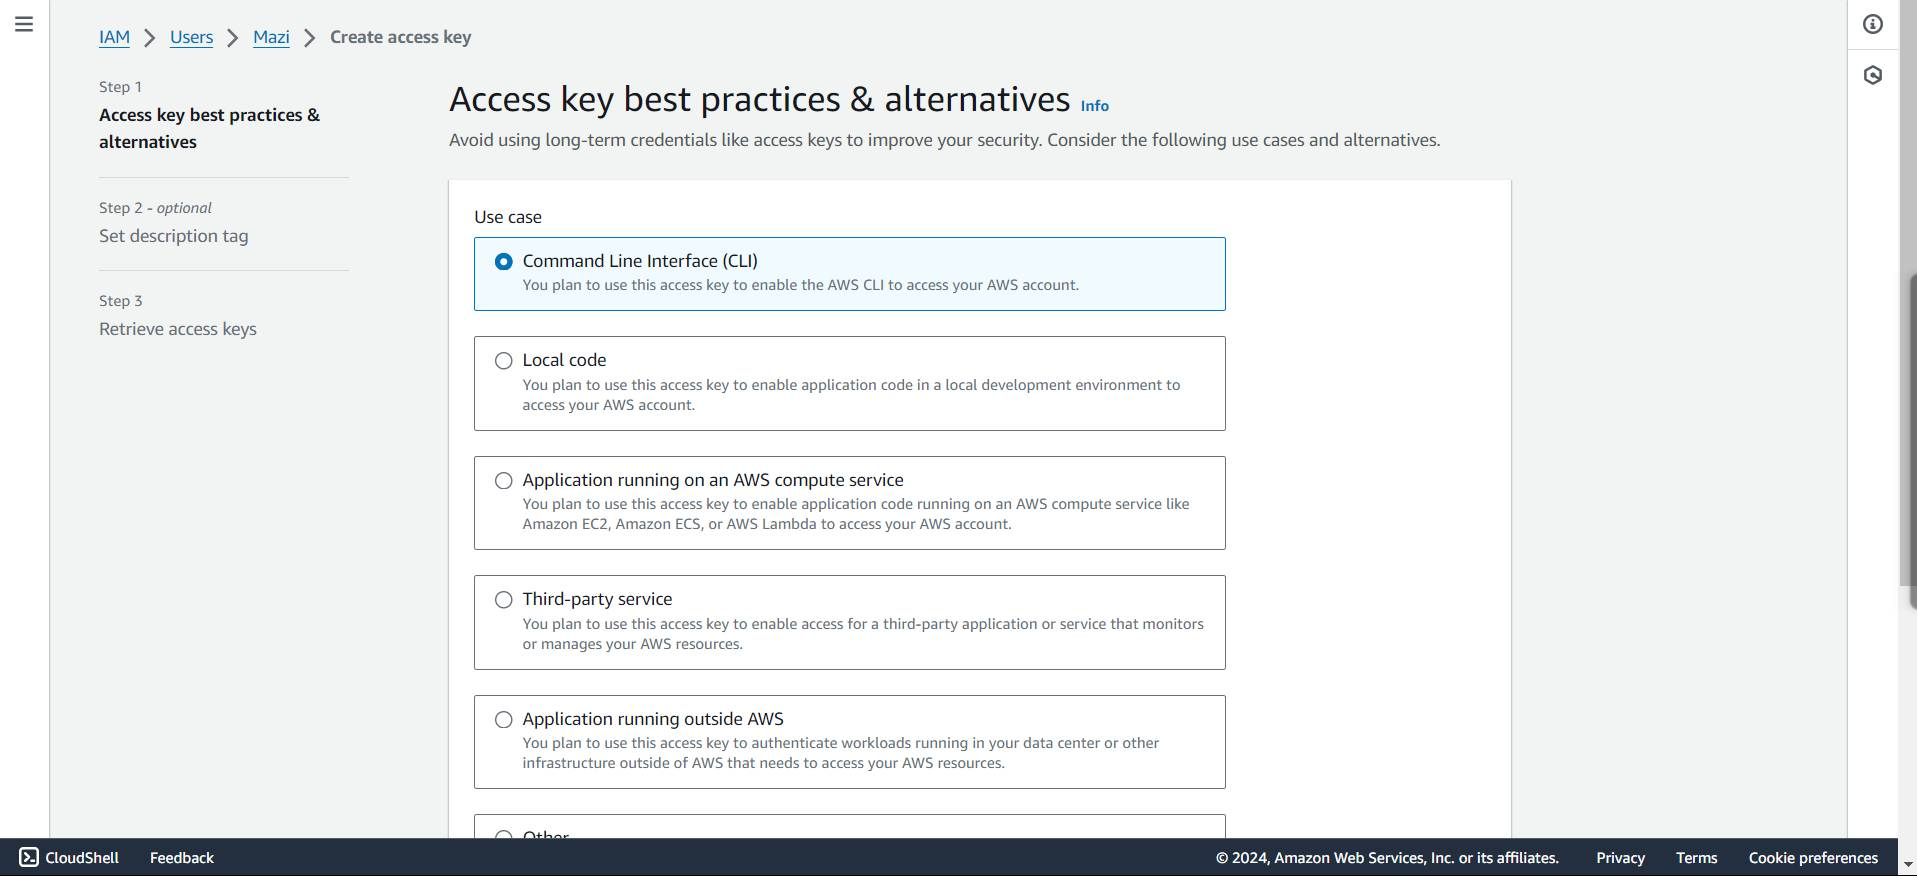 Access key use case
Set the description tag. This step is optional. Then click on the Create access key.
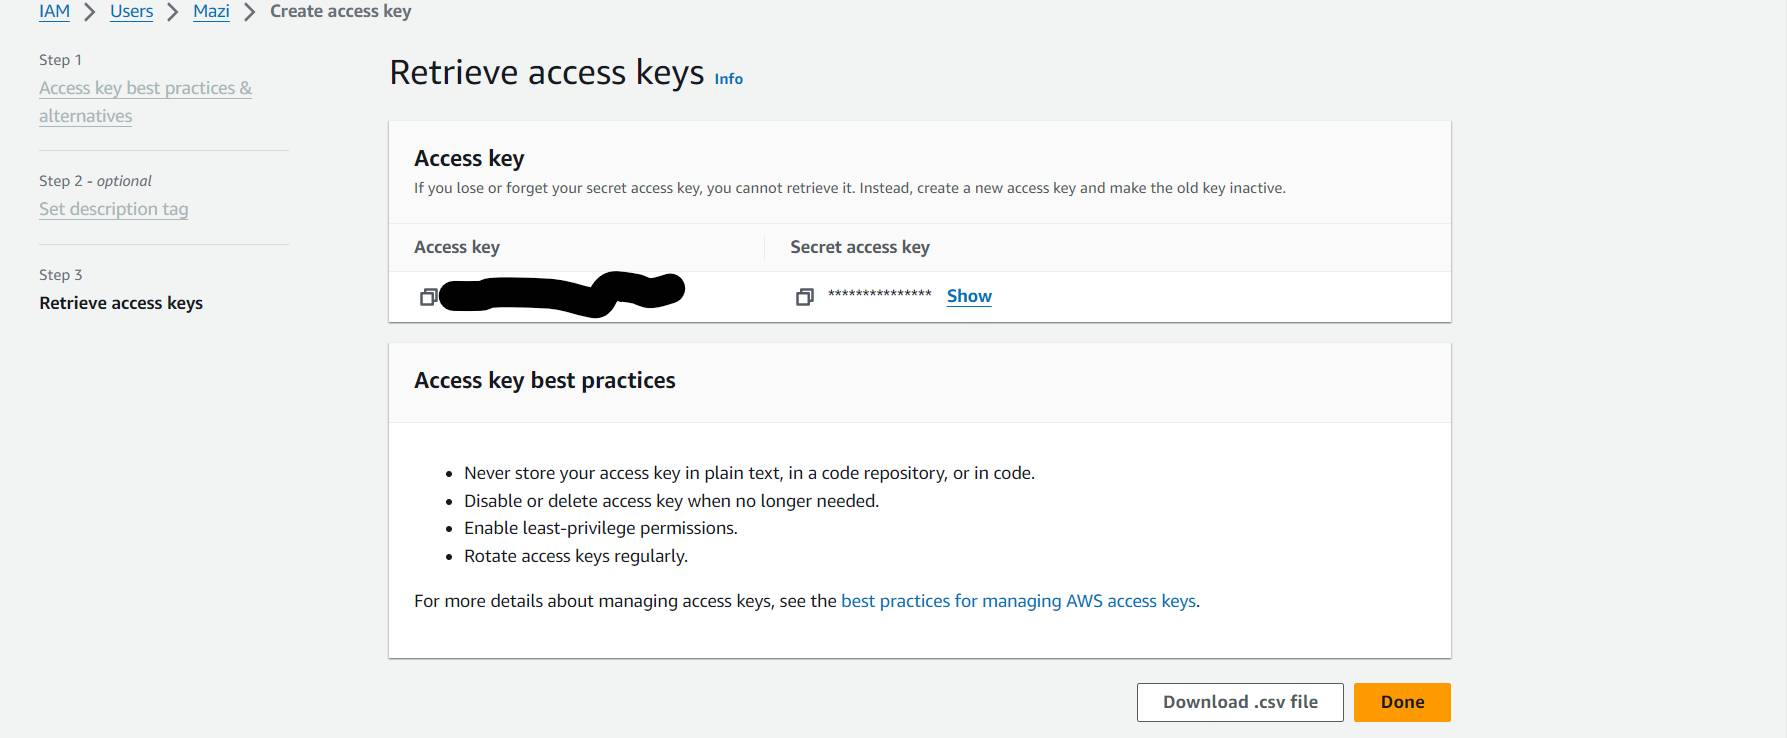 Access keys
Now copy the Access Key ID and Secret access key and paste them into the CloudWatch Datasource configuration page on Grafana. Set your default cloud region – in this case, mine is us-east-1
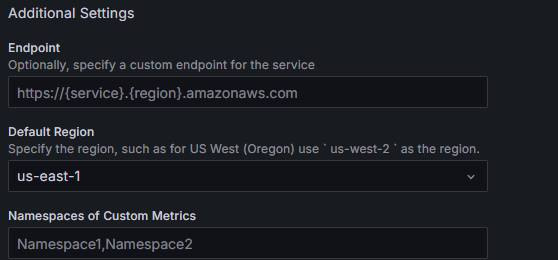 Additional settings
When you’re done, click on the save and test buttons. Grafana will query the Cloudwatch logs, and if it works fine it will save the configuration.
How to Create a Dashboard on Grafana
Now that you have successfully configured your grafana service, let’s start creating dashboards.
Click on the dashboard tab on the side menu click on New and select new dashboard. You should see the screen below:
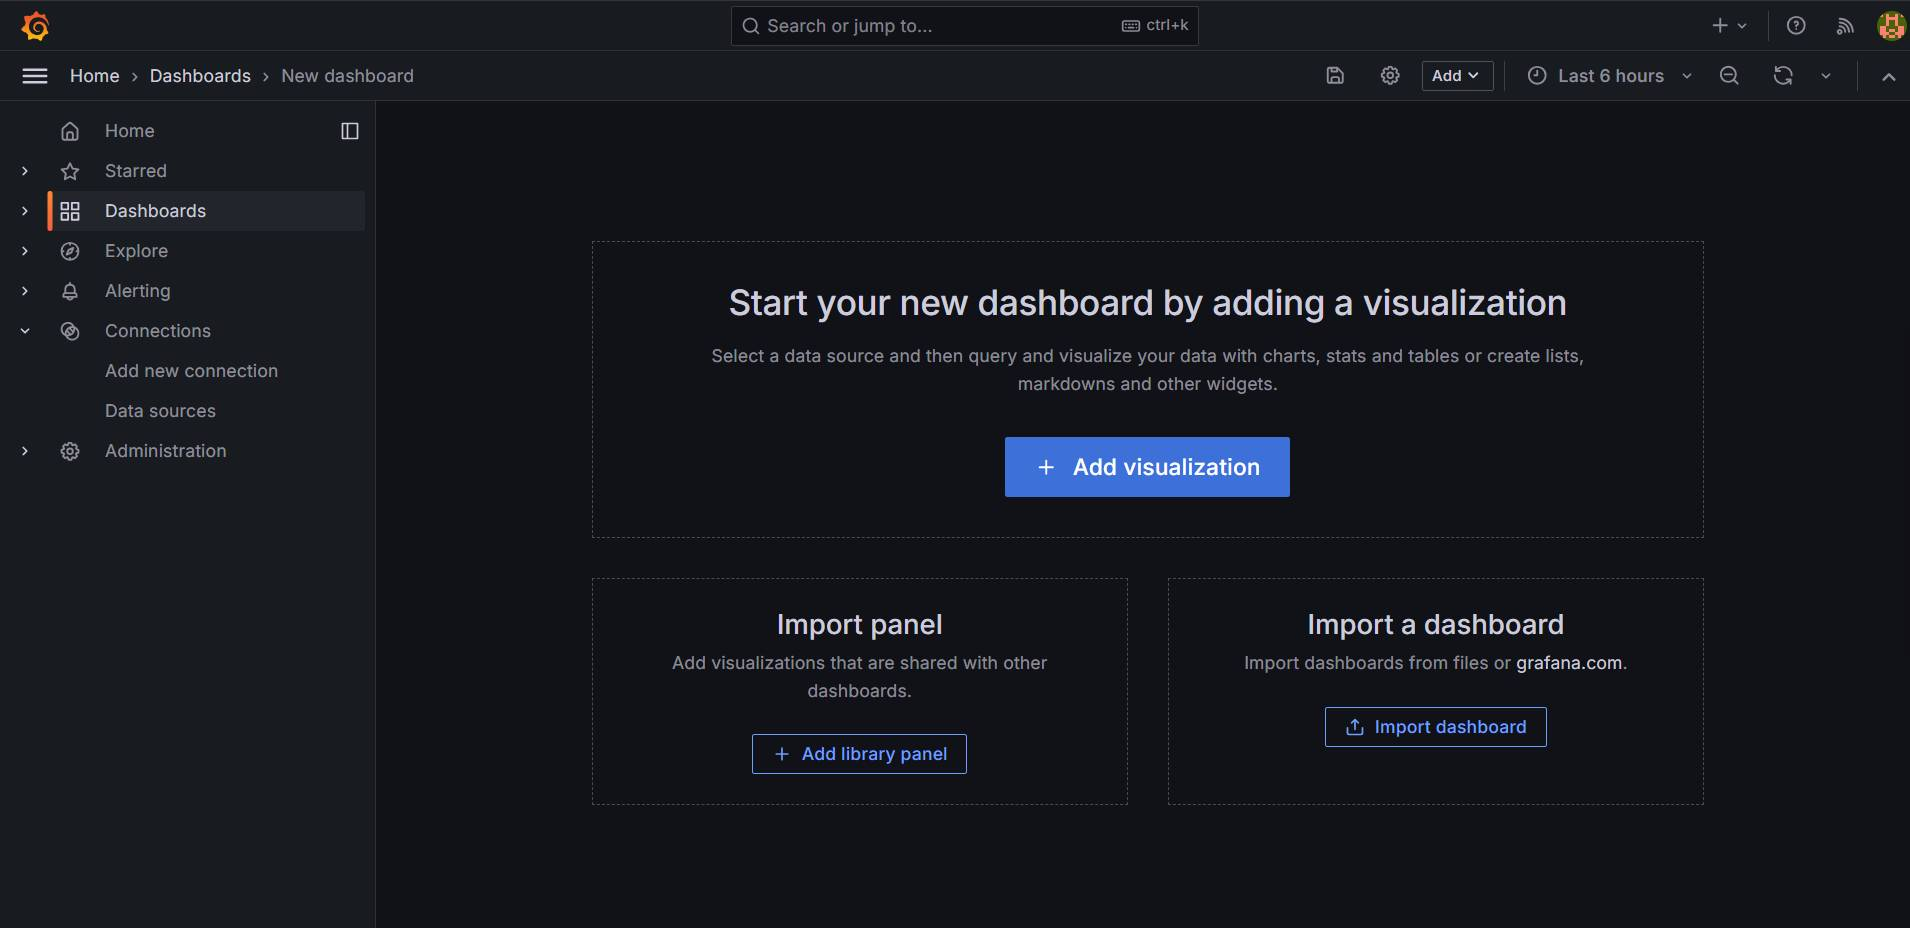 Create a new dashboard
Then select Import dashboard.
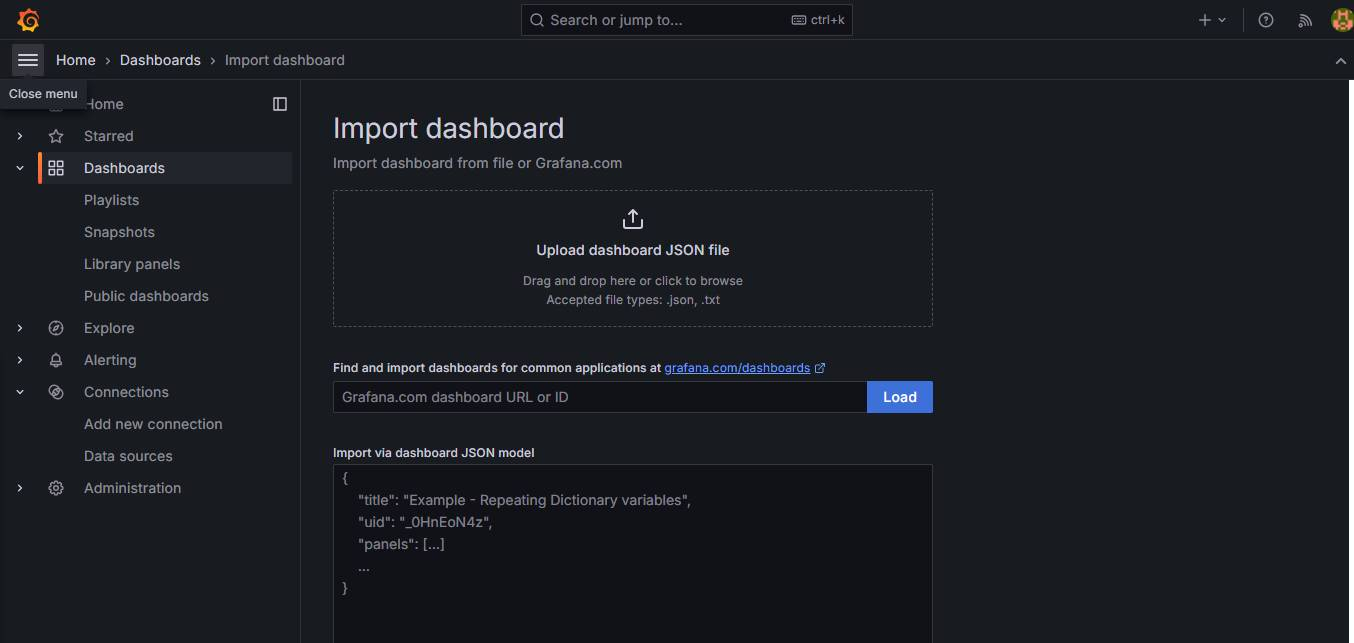 Import a dashboard
For this case, you’ll be importing an already-made dashboard from Grafana. Grafana has a lot of dashboards for a lot of use cases and services. But in this case, you’ll be importing an EC2 dashboard (Grafana EC2 dashboard).
If you want to import it, you can easily copy the ID of the dashboard that you want to import. It is always accompanied by the dashboard.
So now copy the ID – in this case, it’s 11265. Then paste it into the import field on the import dashboard, and click on the load button.
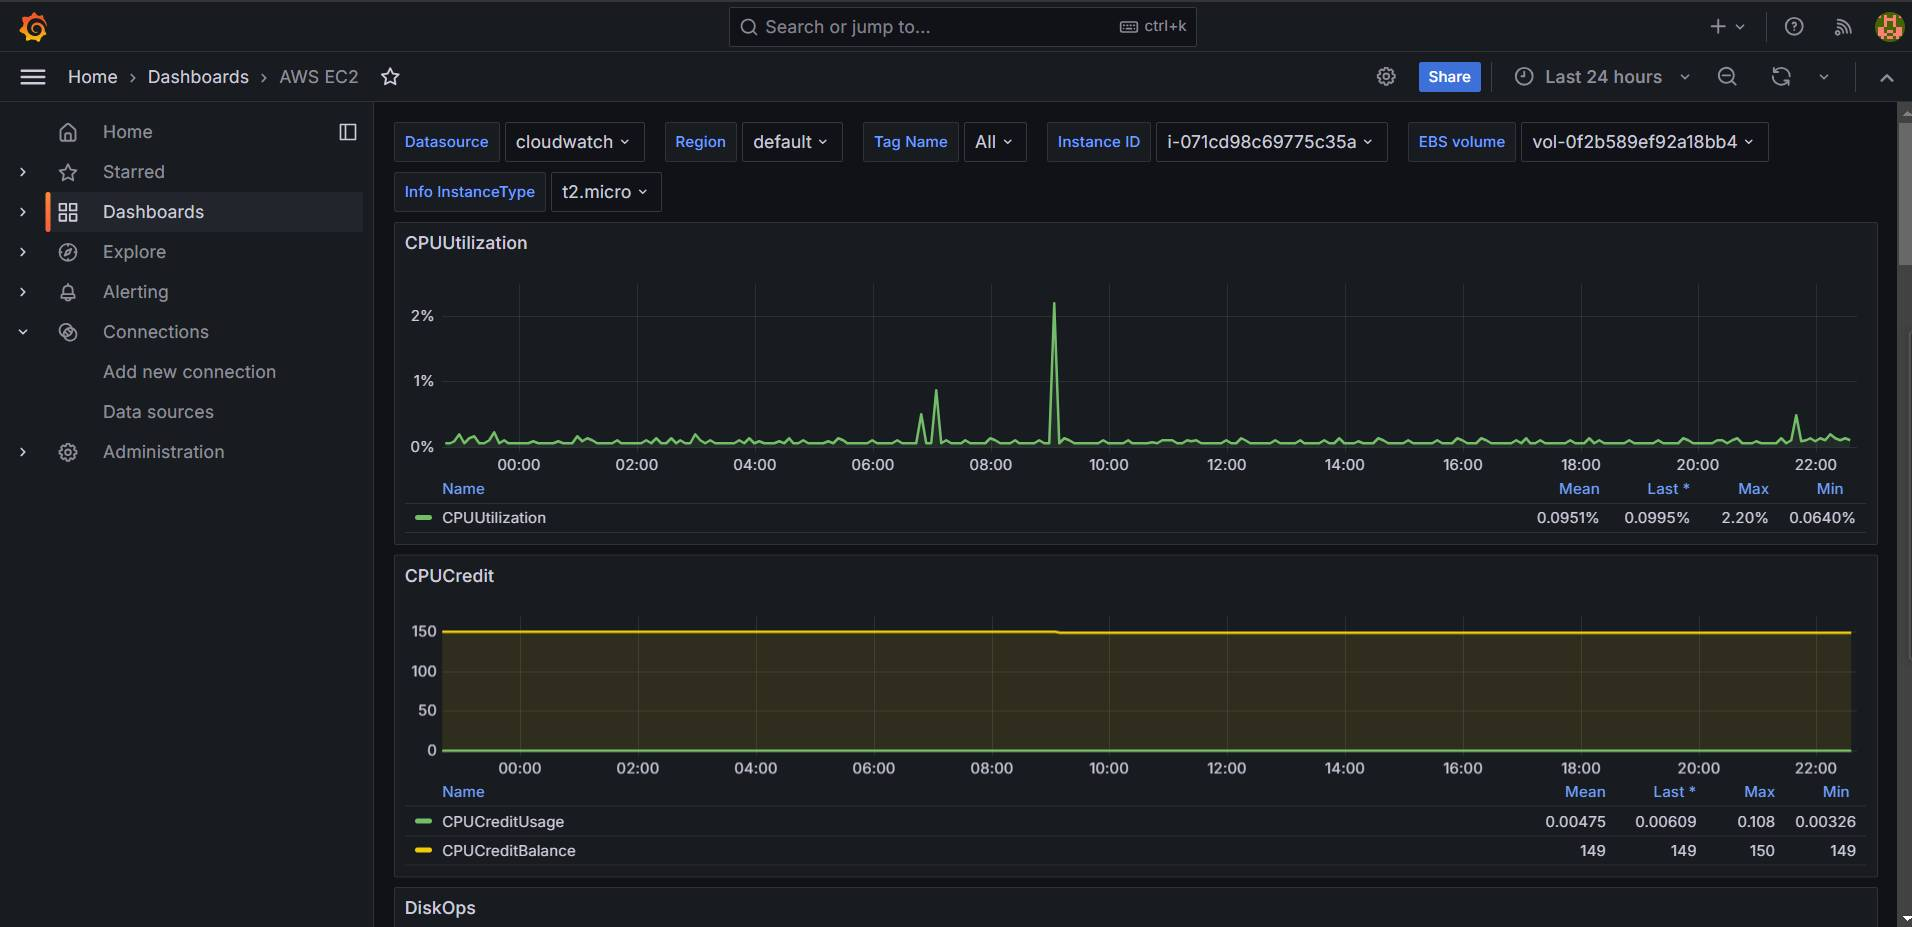 Grafana Dashboard
Now you have successfully created a dashboard in Grafana. This dashboard lets you monitor the performance of your EC2 instance. You can monitor metrics such as CPU Utilization, CPU Credit, Disk Ops, Disk Bytes, Network, Network Packets, Status check, and so on.
Wrapping Up
Thank you for reading! I hope this step by step guide has helped you learn how to create and set up efficient dashboards using Grafana.