
包阅导读总结
1.
“`
MongoDB、Database Observability、Performance Issues、Diagnostic Process、Solution
“`
2. 本文是“Leveraging Database Observability at MongoDB”系列的第二篇,探讨了如何利用 MongoDB 的可观测性解决实际数据库性能问题,通过一个电商场景示例展示了五步诊断流程及最终解决方案。
3.
– 系列介绍
– 这是“Leveraging Database Observability at MongoDB”系列的第二篇。
– 前情回顾
– 上篇讨论了使用自带工具自动监控和优化数据库。
– 这些工具能回答关键问题,确保性能、生产力和减少停机时间。
– 实际案例
– 阐述诊断性能问题的重要性及难点。
– 以假设的电商场景为例,展示如何解决性能瓶颈。
– 背景:在线电商店流量激增,网站性能变慢。
– 瓶颈识别:多微服务使定位负责延迟的服务具挑战性。
– 五步诊断流程:收集数据和见解、生成假设、优先假设、验证假设、实施和观察。
– 结果:创建索引解决问题,性能提升。
– 结论
– 正确数据收集和迭代工作结合可观测性套件能解决数据库瓶颈。
– 下篇将展示如何与中央观测堆栈和工作流集成。
思维导图: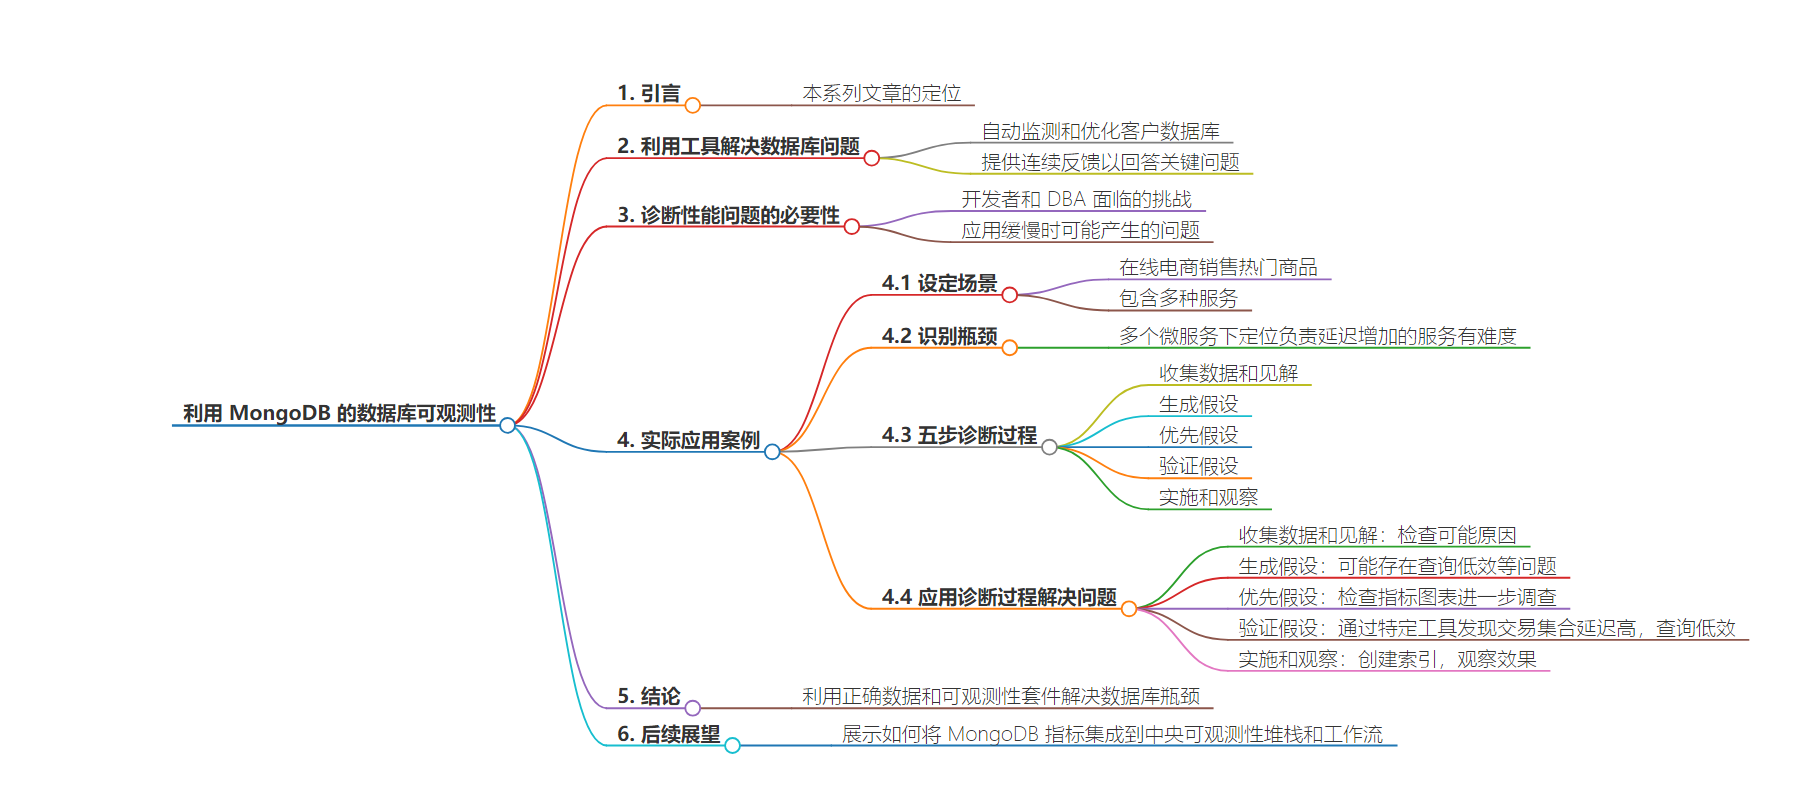
文章地址:https://www.mongodb.com/blog/post/leveraging-database-observability-mongodb-real-life-use-case
文章来源:mongodb.com
作者:Frank Sun
发布时间:2024/7/31 13:20
语言:英文
总字数:830字
预计阅读时间:4分钟
评分:88分
标签:数据库可观察性,MongoDB Atlas,性能优化,电子商务应用程序,诊断流程
以下为原文内容
本内容来源于用户推荐转载,旨在分享知识与观点,如有侵权请联系删除 联系邮箱 media@ilingban.com
This post is the second in our three-part series, Leveraging Database Observability at MongoDB.
Welcome back to the Leveraging Database Observability at MongoDB series. In our last discussion, we explored MongoDB’s unique observability strategy using out-of-the-box tools designed to automatically monitor and optimize customer databases. These tools provide continuous feedback to answer critical questions such as what is happening, where is the issue, why is it occurring, and how do I fix it? This ensures enhanced performance, increased productivity, and minimized downtime.
So let’s dive into a real-life use case, illustrating how different tools in MongoDB Atlas come together to address database performance issues. Whether you’re a DBA, developer, or just a MongoDB enthusiast, our goal is to empower you to harness the full potential of your data using the MongoDB observability suite.
Why is it essential to diagnose a performance issue?
Identifying database bottlenecks and pinpointing the exact problem can be daunting and time-consuming for developers and DBAs.
When your application is slow, several questions may arise:
-
Have I hit my bandwidth limit?
-
Is my cluster under-provisioned and resource-constrained?
-
Does my data model need to be optimized, or cause inefficient data access?
-
Do my queries need to be more efficient, or are they missing necessary indexes?
MongoDB Atlas provides tools to zoom in, uncover insights, and detect anomalies that might otherwise go unnoticed in vast data expanses.
Let’s put it into practice
Let’s consider a hypothetical scenario to illustrate how to track down and address a performance bottleneck.
Setting the context
Imagine you run an online e-commerce store selling a popular item. On average, you sell about 500 units monthly. Your application comprises several services, including user management, product search, inventory management, shopping cart, order management, and payment processing.
Recently, your store went viral online, driving significant traffic to your platform. This surge increased request latencies, and customers began reporting slow website performance.
Identifying the bottleneck
With multiple microservices, finding the service responsible for increased latencies can be challenging. Initial checks might show that inventory loads quickly, search results are prompt, and shopping cart updates are instantaneous. However, the issue might be more nuanced and time-sensitive, potentially leading to a full outage if left unaddressed.
The five-step diagnostic process
To resolve the issue, we’ll use a five-step diagnostic process:
-
Gather data and insights by collecting relevant metrics and data.
-
Generate hypotheses to formulate possible explanations for the problem.
-
Prioritize hypotheses to use data to identify the most likely cause.
-
Validate hypotheses by confirming or disproving the top hypothesis.
-
Implement and observe to make changes and observe the results.
Applying the five-step diagnostic process for resolution
Let’s see how this diagnostic process unfolds:
Step 1: Gather Data and Insights
Customers report that the website is slow, so we start by checking for possible culprits. Inefficient queries, resource constraints, or network issues are the primary suspects.
Step 2: Generate Hypotheses
Given the context, the application could be making inefficient queries, the database could be resource-constrained, or network congestion could be causing delays.
Step 3: Prioritize Hypotheses
We begin by examining the Metric Charts in Atlas. Since our initial check revealed no obvious issues, we will investigate further.
Step 4: Validate Hypotheses
Using Atlas’ Namespace Insights, we break down the host-level measurements to get collection-level data. We notice that the transactions.transactions collection has much higher latency than others. By increasing our lookback period to a week, the latency increased just over 24 hours ago when customers began reporting slow performance. Since this collection stores details about transactions, we use the Atlas Query Profiler to find that the queries are inefficient because they’re scanning through the whole transaction documents. This validates our hypothesis that application slowness was due to query inefficiency.
Step 5: Implement and Observe
We need to create an index to resolve the collection scan issue. The Atlas Performance Advisor suggests an index on the customerID field. Adding this index enables the database to locate and retrieve transaction records for the specified customer more efficiently, reducing execution time. After creating the index, we return to our Namespace Insights page to observe the effect. We see that the latency on our transactions collection has decreased and stabilized. We can now follow up with our customers to update them on our fix and assure them that the problem has been resolved.
Conclusion
By gathering the correct data, working iteratively, and using the MongoDB observability suite, you can quickly resolve database bottlenecks and restore your application’s performance.
In our next post in the “Leveraging Database Observability at MongoDB” series, we’ll show how to integrate MongoDB metrics seamlessly into central observability stacks and workflows. This ‘plug-and-play’ experience aligns with popular monitoring systems like Datadog, New Relic, and Prometheus, offering a unified view of application performance and deep database insights in a comprehensive dashboard.