
包阅导读总结
1. 关键词:
– Keptn
– SLO 分析
– 应用部署
– 监控指标
– 云原生管理
2. 总结:
本文探讨 Keptn 如何应对 SLO 分析的挑战,它是用于云原生应用生命周期管理的工具,能增强部署流程,通过定义数据提供者、SLI、SLO 等来进行自动化评估,收集和评估指标以确保部署健康和性能,有助于提高服务可靠性并降低运营开销。
3. 主要内容:
– 引入 SLO 分析的挑战
– 选择和获取 SLI 和 SLO 值的复杂性
– 定义 SLO 优先级的困难
– 明确和存储 SLO 的重要性
– 介绍 Keptn 生命周期工具包
– 用于云原生应用生命周期管理
– 与多种工具集成,支持 Kubernetes
– 强化部署流程
– 围绕部署进行治理和自动化检查
– 确保满足定义的 SLO
– Keptn 的 SLO 和 SLI 分析
– Metrics Operator 提供统一入口
– 定义数据提供者
– 定义 SLIs
– 定义 SLOs
– 执行分析和检查结果
思维导图: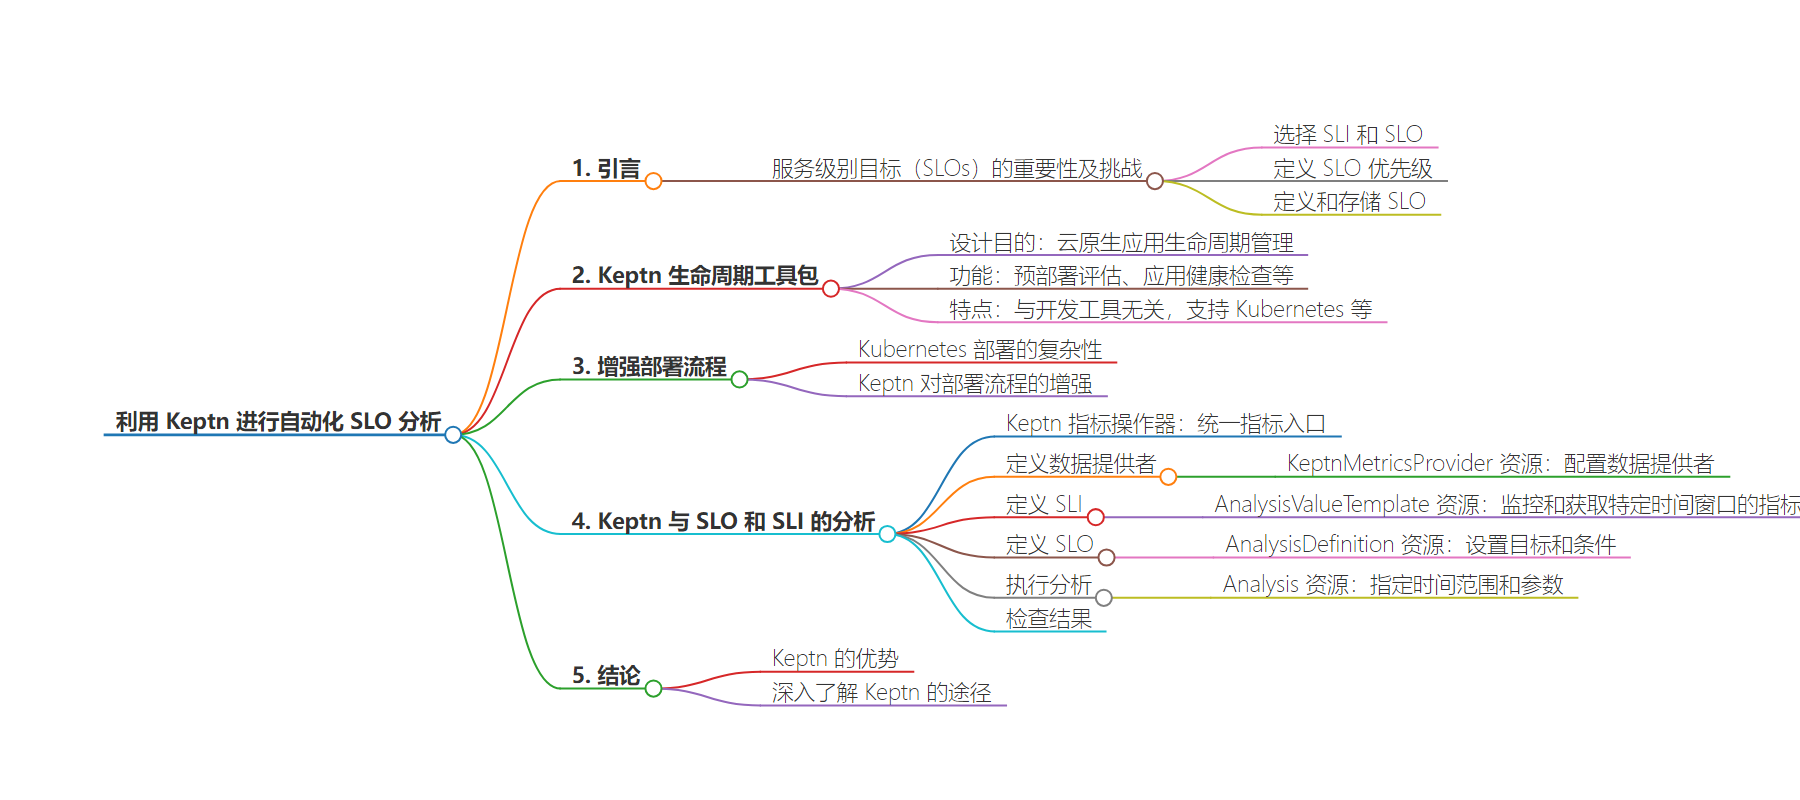
文章地址:https://thenewstack.io/leveraging-keptn-for-automated-slo-analysis/
文章来源:thenewstack.io
作者:Robert Kimani
发布时间:2024/7/24 17:08
语言:英文
总字数:1410字
预计阅读时间:6分钟
评分:83分
标签:Keptn,SLO 分析,Kubernetes,DevOps,云原生
以下为原文内容
本内容来源于用户推荐转载,旨在分享知识与观点,如有侵权请联系删除 联系邮箱 media@ilingban.com
Site reliability engineers (SREs) rely on service-level objectives (SLOs) to set the standards that the service-level indicators (SLIs) of an application must meet. These can include metrics like availability, response time, error rate or any other relevant indicator.
Using SLOs is not new; they have long been used to align technical operations with business goals. But integrating them into an application presents its own challenges:
- Selecting SLIs and SLOs. Deciding whether to get SLI values from one monitoring source or multiple can be complex, making effective use difficult.
- Defining SLO priorities.For instance, a new service version might fix a concurrency issue but slow down response time. This trade-off could be acceptable, so the new version shouldn’t be denied solely due to increased response time if the error rate decreases. We need a way to prioritize SLOs accordingly.
- Defining and storing SLOs. It’s crucial to clearly define and store these goals in a central place, ideally as a declarative resource in a GitOps repository, where changes can be easily traced.
In this article, we will explore how the open source tool Keptn tackles these challenges with its new Analysis feature. We deploy a demo application onto a Kubernetes cluster to show how Keptn helps SREs gather and make sense of SLOs, streamlining the process.
The example application will provide some metrics via its Prometheus endpoint, while other data will come from Dynatrace.
Introducing Keptn Lifecycle Toolkit
The Keptn Lifecycle Toolkit is designed for cloud native application life cycle management. It provides capabilities for pre-deployment evaluations, application health checks, standardized pre- and post-deployment tasks, observability and deployment lifecycle management.
The toolkit is dev-tool agnostic and integrates with GitOps solutions. It supports Kubernetes, offering installation via Helm and monitoring capabilities across namespaces. Keptn aims to streamline the deployment and management of cloud native applications with a focus on declarative operations.
Enhancing Deployment Processes
Deploying software with Kubernetes involves more than just applying a YAML file. Ensuring a healthy deployment requires verifying application health, not just pod status. Keptn enhances deployment processes by wrapping governance and automated checks around deployments, ensuring they meet defined SLOs.
Keptn can run tasks and SLO evaluations before or after deployments. Pre-deployment tasks or evaluations that fail will block the deployment, which is usually desirable to avoid deploying when dependencies are unhealthy.
Keptn Analysis With SLOs and SLIs
The Keptn Metrics Operator provides a unified entry point for all metrics in a Kubernetes cluster. It allows you to define and fetch metrics from various data platforms, enabling evaluations at both workload and application levels, as well as facilitating workload scaling. Metrics can be displayed on dashboards like Grafana or accessed via Kubernetes commands.
Keptn’s Metrics Operator allows you to validate deployments using data from observability providers through the use of SLIs and SLOs.
Defining Data Providers
Everything in Keptn is configured via Kubernetes Custom Resources. We notify Keptn about our monitoring data sources by adding two KeptnMetricsProvider resources to our Kubernetes cluster — one for our Prometheus instance, the other for our Dynatrace tenant.
KeptnMetricsProvider: This resource defines the configuration for a data provider. For example, it can configure Prometheus or Dynatrace as the metrics provider:
The KeptnMetricsProvider resources specify the type of provider (e.g., Prometheus or Dynatrace), the target server URL and any necessary authentication details stored in Kubernetes secrets.
Defining SLIs
Now that we have defined our data sources, we tell Keptn which SLIs to monitor and how to retrieve them from Prometheus and Dynatrace. This is done by applying AnalysisValueTemplate resources to the cluster. If you have worked with Keptn in the past, you will notice that these resources are similar to KeptnMetrics.
The difference between KeptnMetrics and AnalysisValueTemplates is: KeptnMetrics are continuously monitored and updated, representing the latest known value of the given metric. They are good candidates for being observed by a HorizontalPodAutoscaler to make scaling decisions.
AnalysisValueTemplate gets the value of a metric during a specific time window, making it well-suited for tasks like analyzing load test results after deploying a new version. It defines the SLI with the data provider and query, using variables that are substituted at runtime.
We create two AnalysisValueTemplates resources. The first measures the error rate of our workload using data from Prometheus:
The second measures the memory usage of our application:
The spec.query field supports the Go templating syntax, allowing placeholders in the query to be substituted when retrieving the actual metric values.
This is useful when the query is the same for different workloads but differs slightly, such as different label selectors. This way, one AnalysisValueTemplate resource can be reused for different workloads.
Defining SLOs
Next, we set up our SLOs, i.e., the goals we expect to meet. This is done via an AnalysisDefinition resource.
AnalysisDefinition: Lists SLOs with targets and criteria, defining pass/fail conditions and weights for each objective.
This AnalysisDefinition resource has two objectives, referring to the AnalysisValueTemplate resources we created. The objectives differ in weights, meaning that the error-rate goal has a higher priority than memory consumption.
With the target scores defined in the totalScore object, passing the error-rate objective is mandatory for a successful analysis. Even though we use values from different data sources, we don’t need to consider any implementation-specific details when referring to them.
Executing an Analysis
Now, it’s time to trigger an Analysis by applying an Analysis resource.
Analysis: Specifies the timeframe and arguments for the analysis, referencing the AnalysisDefinition.
Applying this resource causes Keptn to:
- Retrieve the values of the
AnalysisValueTemplateresources referenced in theAnalysisDefinitionused for thisAnalysisinstance. - After retrieving all required values, evaluate the objectives and compute the overall result.
The analysis uses the values of the last 10 minutes (spec.timeframe.recent set to 10m). Alternatively, you can specify a concrete timeframe using spec.timeframe.from and spec.timeframe.to properties.
We provide the argument workload to the analysis using spec.args. Arguments passed via this property are used when computing the actual query with the templating string of the AnalysisValueTemplates resource. In our case, we set the query to:
|
rate(http_requests_total{status_code=‘500’, job=‘{{.workload}}’}[1m]) or on() vector(0). |
For our Analysis with spec.args.workload set to simple-go-service, the resulting query is:
|
rate(http_requests_total{status_code=‘500’, job=‘simple-go-service’}[1m]) or on() vector(0) |
Inspecting the Results
After applying an Analysis resource, we can check its state using kubectl:
kubectl commands: Fetch and describe analysis resources, showing the status and details of the analysis.
The output tells us if the Analysis has been completed. If it has, we can inspect the results:
|
kubectl get analysis service–analysis –n simple–go –o yaml |
This command gives us the complete YAML representation of the Analysis:
We see a JSON representation of the retrieved values and the goals set for them in the status.raw field. To make it more readable, we can format it using:
|
kubectl get analysis service–analysis –n simple–go –o=jsonpath=‘{.status.raw}’ | jq . |
The JSON object shows the objectives defined in the AnalysisDefinition, the related metric values, and the actual query used to retrieve the data. Each objective is assigned a score based on whether it has been met. If the objective is met, it gets the full weight; if not, it gets a score of zero. We can also specify warning criteria for more granular grading.
By configuring KeptnMetricsProvider, KeptnMetric, Analysis, AnalysisDefinition, and AnalysisValueTemplate resources, Keptn collects and evaluates metrics against defined SLOs to ensure deployment health and performance.
Conclusion
Keptn transforms cloud native application management by automating SLO analysis, enhancing service reliability while reducing operational overhead. By harnessing Keptn’s automated evaluation capabilities, teams can ensure consistent adherence to performance standards across the application life cycle.
We have seen how to define multiple monitoring data sources and let Keptn fetch and provide a unified way of accessing this data. We set clear criteria for deciding whether the application is healthy and performed an analysis to interpret the results. All of this was done using Kubernetes manifests and placing them in a GitOps repository alongside our application’s manifests.
Whether validating new releases, maintaining environment health or guiding autoscaling decisions, Keptn seamlessly integrates with existing DevOps tools, empowering modern application development and operations. To delve deeper into Keptn’s capabilities, visit the Keptn GitHub repository and engage with the vibrant community.
YOUTUBE.COM/THENEWSTACK
Tech moves fast, don’t miss an episode. Subscribe to our YouTubechannel to stream all our podcasts, interviews, demos, and more.