
包阅导读总结
1.
关键词:Prometheus、Grafana、数据源、大帐篷哲学、可观测性
2.
总结:本文主要讲述了 Grafana 对 Prometheus 数据源的更新,包括对 AWS 和微软 Azure 的处理,强调了“大帐篷”哲学的演变,以满足用户需求和凸显数据源差异,同时提到持续关注互操作性,并将创建新的公共路线图。
3.
主要内容:
– 对 Prometheus 数据源的更新
– 弃用原 Prometheus 数据源的 AWS 认证,创建新的亚马逊托管服务插件
– 计划对 Prometheus 和微软 Azure 做类似更新
– “大帐篷”哲学的演变
– 致力于满足用户需求,重视软件互操作性
– 凸显数据源间的有意义差异,避免最低标准
– 开源和基金会项目应与上游 API 兼容,体现中立性
– 欢迎相关专有项目以独立数据源形式加入
– 未来计划
– 持续关注互操作性,维护插件和集成
– 为开源项目做贡献
– 创建新公共路线图,听取用户反馈
– 使 Grafana 的“大帐篷”更大更好
思维导图: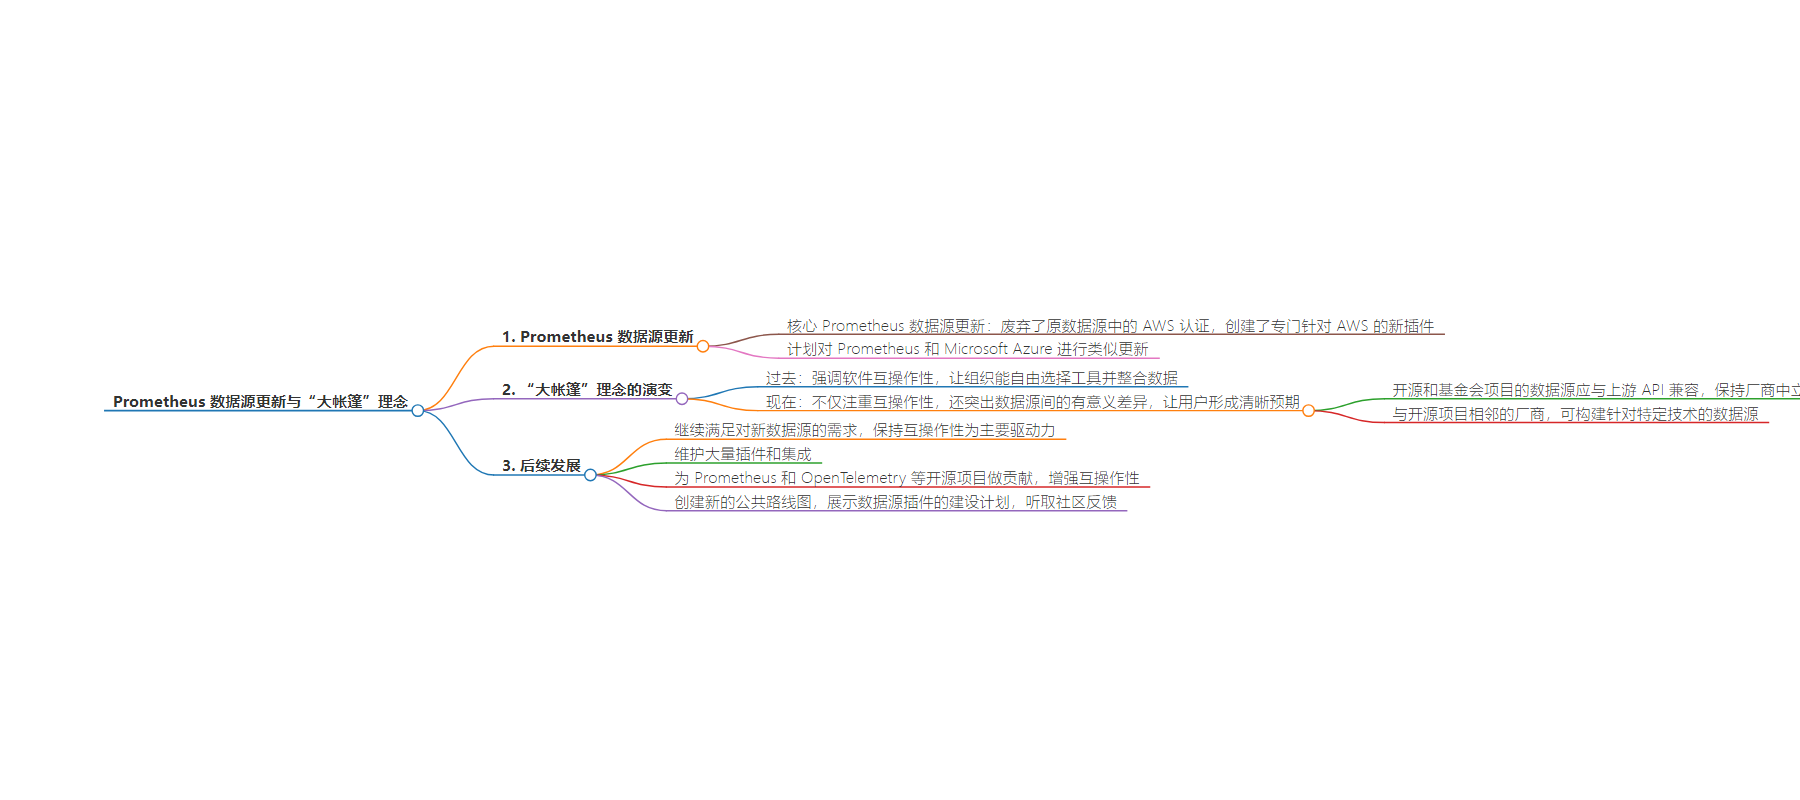
文章来源:grafana.com
作者:Logan Smith,Evan Dandrea
发布时间:2024/8/6 10:41
语言:英文
总字数:945字
预计阅读时间:4分钟
评分:90分
标签:Grafana,数据源,Prometheus,可观测性,云原生
以下为原文内容
本内容来源于用户推荐转载,旨在分享知识与观点,如有侵权请联系删除 联系邮箱 media@ilingban.com
As we continue adding to our growing catalog of more than 100 plugins for Grafana, we have been focused on developing data sources for Grafana that are more purpose-built for the respective technologies.
One example has been the recent update to our core Prometheus data source. We have deprecated AWS authentication from the original Prometheus data source, and we created a new dedicated Amazon Managed Service for Prometheus plugin that will specifically cater to the AWS use case. If you are a Grafana user who uses Amazon Managed Prometheus (AMP), you can learn more about how to install or migrate to the new plugin in our Amazon Managed Service for Prometheus documentation.
We plan to do the same update in regards to Prometheus and Microsoft Azure, and we will continue to explore how to make other data sources in the Grafana ecosystem more purpose-built over time.
A bigger “big tent”
This refined focus on our data sources is a reflection of our commitment to meet our users where they are.
Observability today is a complicated space. Companies of all sizes have adopted numerous open source and commercial tools to monitor an ever expanding sprawl of infrastructure, applications, and even physical devices. In our recent 2024 Observability Survey, 72% of the active Grafana users polled had at least four data sources configured in Grafana. Not to mention, one in 10 Grafana users said they pull in data from more than 50 data sources.
It shouldn’t come as a surprise to anyone reading this, that this explosion in observability tools has been a pretty great wave for Grafana Labs to ride thanks to our commitment to our “big tent” philosophy. We believe that organizations should own their observability strategy, have the freedom to choose their own tools, and have the ability to bring all their data together in one view, no matter where it lives. As a result, Grafana has quickly become the de facto visualization tool for centralized observability.
But over the years, we have evolved our understanding of what “big tent” stands for. While we still prioritize software interoperability, “big tent” also means surfacing the meaningful differences between data sources so users can form clear expectations and avoid solving for the lowest common denominator. These differences are in the values of each upstream project as much as they are in APIs.
In our opinion, data sources with open source and foundation-run projects should be exclusively compatible with the upstream APIs and reflect the project’s vendor neutrality. Vendors adjacent to these open source projects, with their own API and differences, are also invited into the big tent: You can build data sources that are tailored to your specific technology and still reach the Grafana community. (Potential partners can enquire about working directly with us on commercial data source publishing options at integrations@grafana.com.) But whether it comes from a commercial partner or the community, we believe that each data source should have a clear purpose and lean into that goal.
Prometheus is a standout example. Throughout a decade of development, this open source project has grown into a gold standard for time series metrics data and is critical infrastructure for businesses across the industry. It remains a vibrant and independent project under the governance of the Cloud Native Computing Foundation (CNCF), with countless open source contributors continuing to evolve the code to support challenges, and a thriving community providing a colossal support apparatus.
Users of our core Prometheus data source should expect this data source to closely mirror the functionality developed and supported within this community. The data source itself should not be overcomplicated or otherwise confuse users with proprietary functionality that branches off of the Prometheus project.
Meanwhile, the proprietary projects in Prometheus’s orbit should be built and welcomed into the community as separate data sources. This is why we have provided Grafana users who use Amazon Managed Prometheus (AMP) with access to the Amazon Managed Service for Prometheus plugin, which supports platform-specific AWS Signature Version 4 authentication.
What’s next
We feel this new “big tent” approach has been a natural evolution we’ve seen in the industry as we continue to field requests for new data sources that span a wide range of licensing models and that support every flavor of platform-specific auth, query language, feature, and more.
But interoperability continues to be one of the primary drivers of our roadmap. We maintain 100+ plugins for Grafana and 65+ Grafana Cloud integrations for monitoring third-party tools. Our open source projects, including the core technology behind the Grafana LGTM Stack (Loki for logs, Grafana for visualization, Tempo for traces, and Mimir for metrics), are built on “big tent” principles. We also contribute to OSS projects such as Prometheus (we are the No. 1 company contributor) and OpenTelemetry, with a focus on making the two projects more interoperable.
While this is our current thinking on “big tent” and interoperability, we want to continue to listen to our community, partners, and users to better refine our approach. Please reach out to the team at integrations@grafana.com if you have any feedback, questions, or concerns.
We are also delighted to share that we are creating a new public roadmap that shows all of the date source plugins being built by Grafana Labs, our partners, and our community. Grafana Cloud users can now see our current plans and request new plugins, upvote existing requests, or comment with ideas and requirements. Grafana OSS and Grafana Enterprise users will soon have access to the public roadmap as well.
No matter how you engage with our community, we want to hear from you and learn how we can make Grafana’s “big tent” bigger and better.