
包阅导读总结
1. 关键词:Observability、Monitoring、IT 基础设施、系统行为、差异
2. 总结:本文探讨了 Observability 和 Monitoring 在 IT 基础设施中的作用与差异,包括目标、数据使用、工具和在事件响应中的角色,指出两者各有优势和适用场景,结合使用能强化 IT 策略。
3. 主要内容:
– Observability 和 Monitoring 对确保 IT 基础设施健康和性能至关重要
– 目标不同
– 监测主要基于预设阈值检查系统健康和性能
– 可观测性旨在通过分析外部输出来理解系统内部状态
– 所依赖的遥测数据不同
– 监测依赖预定义的指标、日志和有时的跟踪
– 可观测性利用更广泛的数据点
– 所需工具不同
– 监测工具用于收集和可视化数据以生成警报
– 可观测性需要更广泛的包含分析和探索的工具集
– 在事件响应中的角色不同
– 监测提供快速检测和通知
– 可观测性在检测到事件后提供深入细节以找到根本原因
– 各自适用场景
– 监测适用于已知问题和可预测环境
– 可观测性适用于复杂动态环境
思维导图: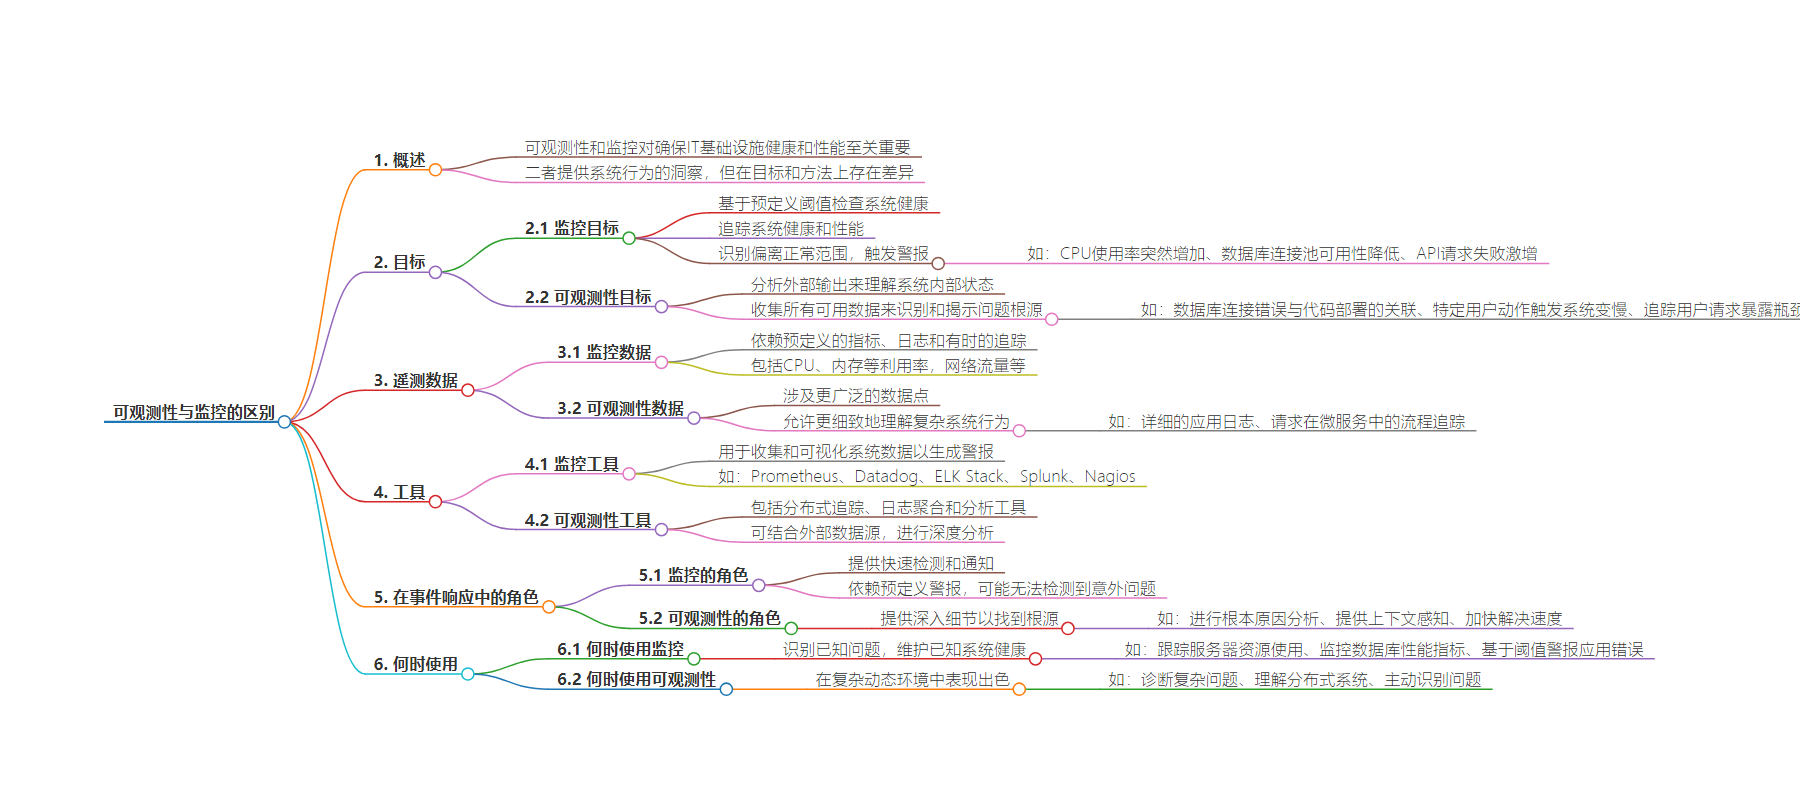
文章地址:https://thenewstack.io/whats-the-difference-between-observability-and-monitoring/
文章来源:thenewstack.io
作者:Kumar Harsh
发布时间:2024/8/9 20:04
语言:英文
总字数:1507字
预计阅读时间:7分钟
评分:88分
标签:可观测性,监控,IT 基础设施,事件响应,遥测数据
以下为原文内容
本内容来源于用户推荐转载,旨在分享知识与观点,如有侵权请联系删除 联系邮箱 media@ilingban.com
Observability and monitoring are crucial for ensuring IT infrastructure health and performance. Both provide insights into system behavior but differ in goals and approaches.
Traditionally, monitoring focused on reacting to alerts triggered by predefined metrics. However, the growing complexity of modern systems demands a more proactive approach. Observability helps teams understand the “why” behind system behavior, allowing them to anticipate and resolve issues faster.
Let’s explore the key differences between observability and monitoring, their goals, data usage, tooling and roles in incident response. You’ll also learn when each approach is most effective and how combining them can strengthen your IT strategy.
Let’s start by exploring a few key distinctions.
The Goal
The fundamental difference between observability and monitoring lies in their goals.
Monitoring Goals
Monitoring acts like a vigilant guard, constantly checking system health against predefined thresholds for signs of trouble. Its primary goal is to track the health and performance of systems based on established metrics and logs, like CPU utilization, memory usage, server response times or even application-specific data points.
Monitoring tools excel at identifying deviations from normal operating ranges, triggering alerts when thresholds are breached. It’s good at detecting things like:
- A sudden increase in CPU usage that might indicate a process gone rogue, requiring immediate attention.
- A decrease in database connection pool availability that might indicate an application struggling to connect, which could hurt user experience.
- An unusual surge in API request failures that could point to a potential service degradation.
Observability Goals
While monitoring excels at identifying deviations, observability aims to understand the system’s internal state by analyzing its external outputs. Similar to a detective looking at clues at a crime scene, observability gathers all available data (metrics, logs, traces and events) to not only identify the issue but also uncover its root cause. This holistic view allows teams to diagnose complex problems and anticipate potential breakdowns before they occur.
Examples of issues observability tools help identify include:
- A correlation between increased database connection errors and a recent code deployment could pinpoint a bug in the new code.
- Analyzing application logs might reveal a specific user action triggering system slowdowns, enabling targeted optimization efforts.
- Tracing a user request through the entire system could expose bottlenecks or inefficiencies affecting performance.
Telemetry Data
Observability and monitoring tools depend on the telemetry data they collect. The types and volume of data used differ significantly between the two.
Monitoring Data
Monitoring tools typically rely on a well-defined set of metrics, logs and sometimes traces from specific systems. These metrics are preselected based on their known importance to stability and performance.
They include CPU, memory and disk utilization, network traffic volume, database query execution times and application-specific performance indicators. Logs capture textual information about system events and user actions. Traces, though less frequently used in traditional monitoring, can provide a sequence of events that led to a specific issue. By focusing on this predetermined data set, monitoring tools offer a clear and concise view of core system functions.
Observability Data
Observability taps into a wider range of data points, including logs, traces, events and even custom, app- or service-specific metrics. This enables a more nuanced understanding of complex system behavior.
For instance, observability tools might capture detailed application logs containing error messages, user actions and API-request payloads. Traces would provide a step-by-step journey of a request as it travels through various microservices, revealing potential bottlenecks or integration issues. In addition, observability might integrate with external data sources like infrastructure monitoring tools or user behavior analytics platforms, painting a holistic picture of the ecosystem.
This vast telemetry data allows for in-depth analysis using advanced techniques like anomaly detection and machine learning. Correlating diverse data points enables teams to discover hidden patterns, anticipate potential problems and ultimately gain a deeper understanding of how their systems operate.
Tooling
Observability and monitoring require distinct sets of tools.
Monitoring Tools
A well-established set of monitoring tools is designed for collecting and visualizing system data to generate alerts. Alerts are triggered when thresholds are breached. Popular choices include:
- Metrics collection and visualization tools such as Prometheus and Datadog. These gather and display system metrics in real time, allowing teams to monitor CPU usage, memory consumption and other vital statistics.
- Log management tools like the ELK Stack and Splunk. These centralize and analyze log data from various systems, enabling efficient troubleshooting and the identification of error messages or anomalous events.
- Alerting tools like Nagios that automatically send notifications when predefined thresholds are crossed, ensuring timely awareness of potential issues.
These tools clearly present core system vitals, but preconfigured metrics and alerting rules make them rigid. While effective against known issues, they might struggle to identify unforeseen problems or provide deeper insights into root causes.
Observability Tools
Observability requires a broader toolkit comprising not just data collection and visualization but also analysis and exploration. Popular examples include:
- Distributed tracing tools like Zipkin or Jaeger, which track request flow across microservices within a distributed system, pinpointing bottlenecks and integration issues.
- Log aggregation and analysis tools (similar to log management) provide advanced capabilities for log querying, filtering and correlation, helping pinpoint the root cause of issues from log data.
These tools, along with integrations with external data sources, enable teams to explore vast amounts of telemetry data. The analytical nature of observability also allows you to incorporate AI and machine learning tools, unlocking features like predictive analytics, proactive anomaly detection and root-cause analysis.
Role in Incident Response
Both monitoring and observability are crucial in incident response.
Monitoring’s Role in Incident Response
Monitoring is the first line of defense, providing rapid detection and notification, but its reliance on predefined alerts might leave unforeseen issues undetected. In addition, the initial alert might not provide enough context to pinpoint the root cause efficiently.
Obervability’s Role in Incident Response
Observability picks up where monitoring leaves off, providing the depth and detail needed to get to the root cause once an incident is detected.
Here’s how observability empowers a successful incident response:
- Root cause analysis: By analyzing a wider range of data (logs, traces and events), observability helps teams understand the “why” behind an issue, not just the “what.”
- Contextual awareness: Observability tools provide richer context around incidents, including historical data and system interactions, facilitating a more informed troubleshooting process.
- Faster resolution: Deeper insights into root causes enable faster and more targeted solutions, minimizing downtime and ensuring quicker service restoration.
When to Use Monitoring
Monitoring excels at identifying known issues and maintaining the health of well-understood systems:
- It’s simple and easy to use: Monitoring tools are generally simpler to set up and use compared to observability tools. They offer preconfigured dashboards and alerts, making them ideal for monitoring core system functions.
- It tracks established metrics: Monitoring excels at tracking predefined metrics and alerting on deviations from normal operating ranges. This makes it perfect for identifying issues like CPU overload, memory leaks or database connection pool exhaustion.
Traditional monitoring tools offer a clear view of system health in static environments with predictable workloads. Examples of when monitoring is the preferred approach are when you’re:
- Tracking server resource usage (CPU, memory, disk space).
- Monitoring database performance metrics (query execution times, connection pool availability).
- Alerting on application errors based on predefined thresholds.
Keep in mind that the predefined nature of monitoring can limit its ability to handle unforeseen issues or complex system interactions within modern, dynamic environments.
When to Use Observability
Observability excels in complex, dynamic environments.
- Diagnosing complex issues: Observability’s ability to analyze a wider range of data helps teams pinpoint the root cause of intricate problems arising from system interactions or unforeseen circumstances.
- Understanding distributed systems: Observability tools like distributed tracing shed light on how requests flow through microservices within a distributed system, exposing bottlenecks and integration issues.
- Proactive problem identification: By analyzing historical data and system behavior, observability can identify potential problems before they escalate, enabling preventative measures.
Examples of when observability is the best choice are:
- Correlating application logs with infrastructure metrics to diagnose performance issues.
- Tracing a user request through a microservices architecture to identify bottlenecks.
- Using machine learning within observability tools for anomaly detection and predictive maintenance.
While observability offers a deeper understanding, its implementation can be more complex and require a broader skill set.
Observability and monitoring are complementary rather than alternative practices. Monitoring is a vigilant guard while observability is a thoughtful analyst. Being able to react to some issues immediately while preventing others and making overall system improvements over time — the winning strategy combines both.
Using both sets of tools enables you to truly control your applications’ destiny. If you run highly distributed, high-performance applications and need to be in full control of your cloud infrastructure, consider Equinix dedicated cloud. Using its best-in-class set of infrastructure primitives on a global basis, you can build the cloud you need rather than adjusting to the cloud built by someone else.
YOUTUBE.COM/THENEWSTACK
Tech moves fast, don’t miss an episode. Subscribe to our YouTubechannel to stream all our podcasts, interviews, demos, and more.